Analytics
Learn how to access and analyze viewership data for your content using our comprehensive analytics tools. Analytics are available for all user types, with different levels of detail based on user permissions.
Analytics are only available for the Bitmovin Player. Other player implementations will not display these metrics unless integrated with a Bitmovin Analytics License Key.
View your report
Use various options from the Analytics menu to get the desired results.
Start by selecting the type of analysed video or specific asset.
Settings
The next step would be choosing the type of analytics and breaking down your report by a selected factor. Available options are listed below.
Analytics type:
- Plays
- Concurrent Viewers
- Total Hours Watched
- Average View Time
- Total Startup Time
- DRM Load Time
- Bandwidth
- Video Bitrate
- Top Screen Resolutions (Landscape)
- Top Screen Resolutions (Portrait)
- Top Subtitles
- Top Audio Tracks
- Top Error Codes
- Ad Requests
- Successful Ad Plays
- View Rate
- Click Rate
Breakdown by:
- None
- Video Title
- Browser
- CDN Provider
- Country
- Operating System
- Platform
- Player
- Player Version
- Player Tech
- ISP
- Device Class
- Device Type
- Video Codec Type
- Stream Format
- Domain
- Experiment Name
- Custom Data (1-6)
Breakdown functionality is not available for all analytics types.
Your selected options will appear immediately on the report.
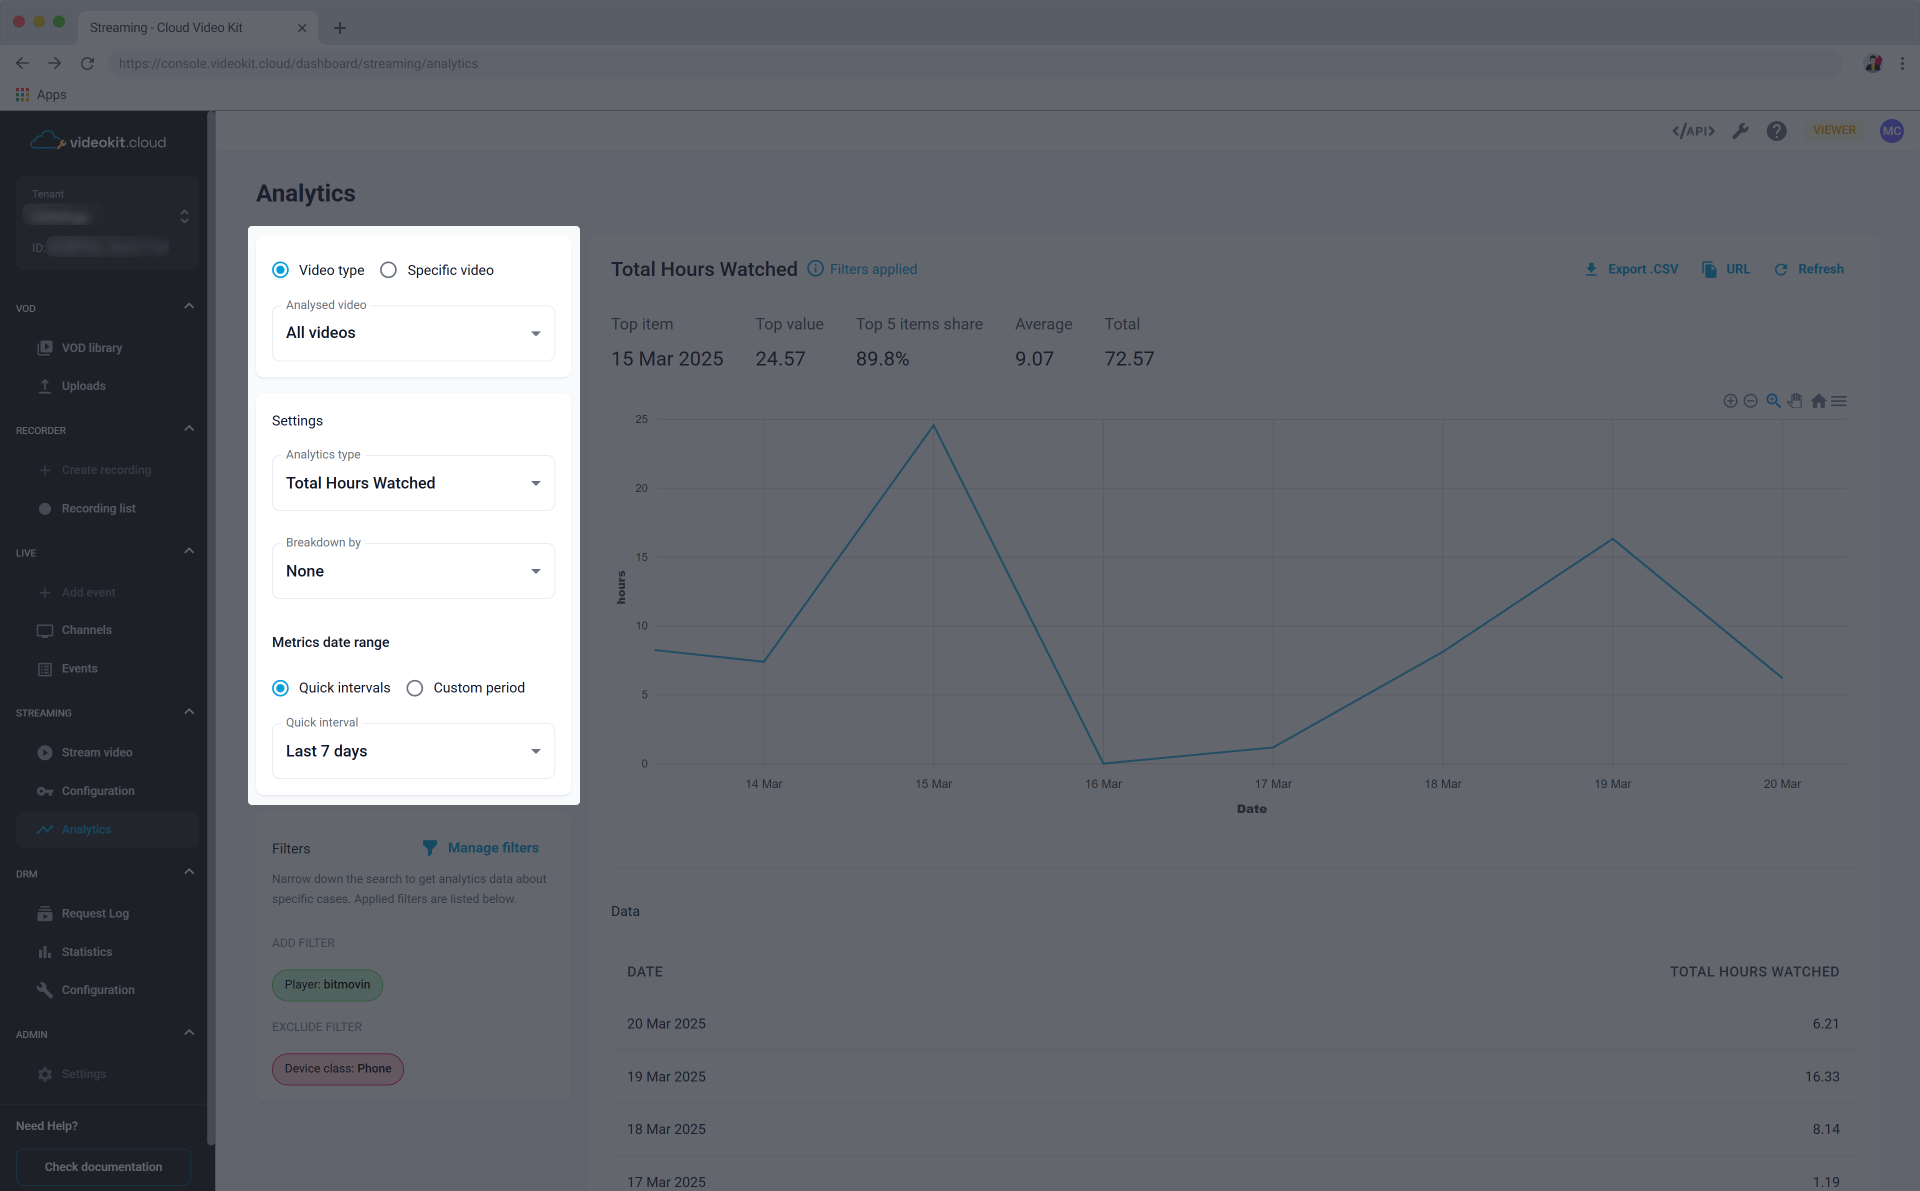
Make sure to adjust the metrics data range. You can adjust the range up to the last 30 days.
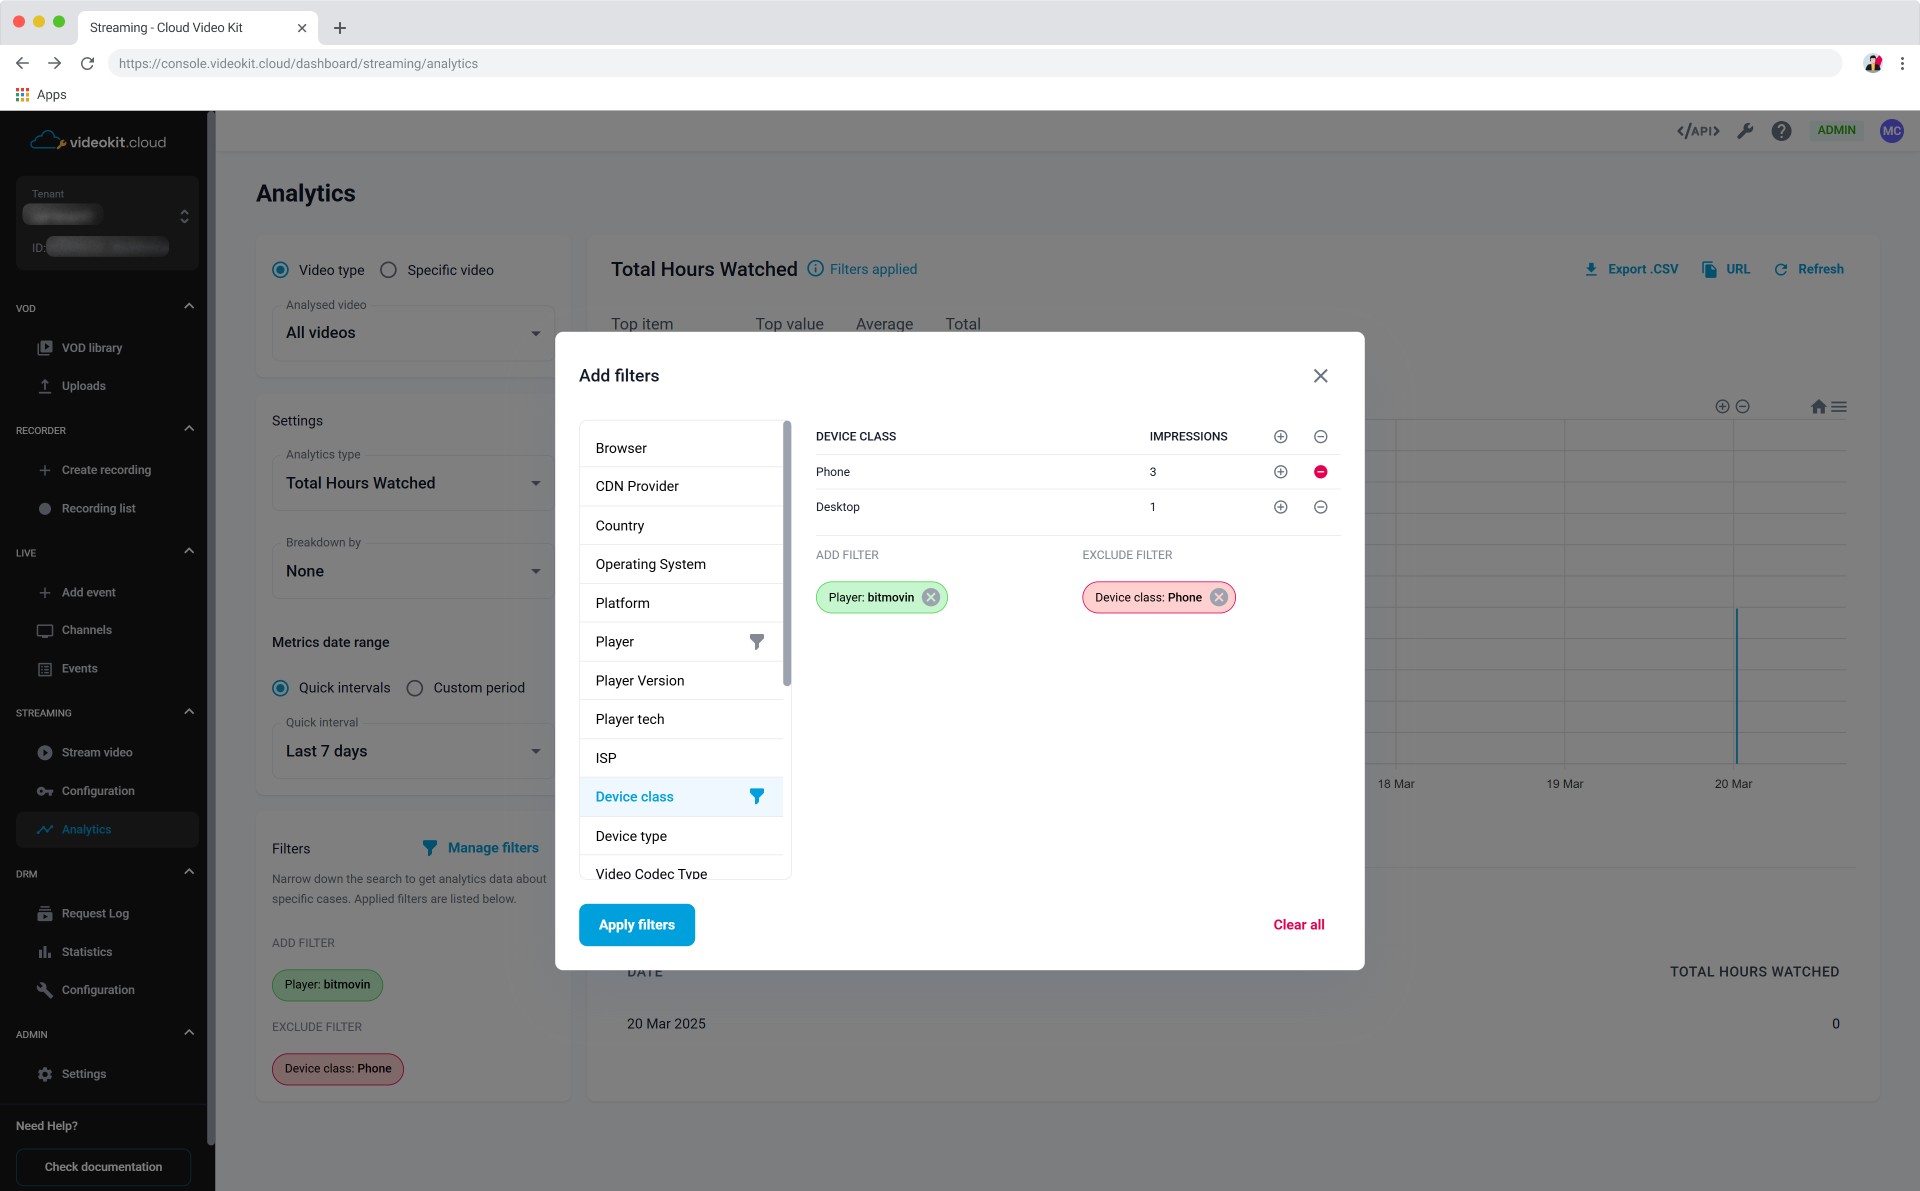
Filters
Filter your analytics view with the following options. Enter filters menu by using the Manage filters button. You can use multiple ADD or EXCLUDE filters.
Available filters:
- Browser
- CDN Provider
- Country
- Operating System
- Platform
- Player
- Player Version
- Player Tech
- ISP
- Device Class
- Device Type
- Video Codec Type
- Stream Format
- Domain
- Experiment Name
- Custom Data (1-6)
Make sure to click the Apply filters button to see results on the live report.
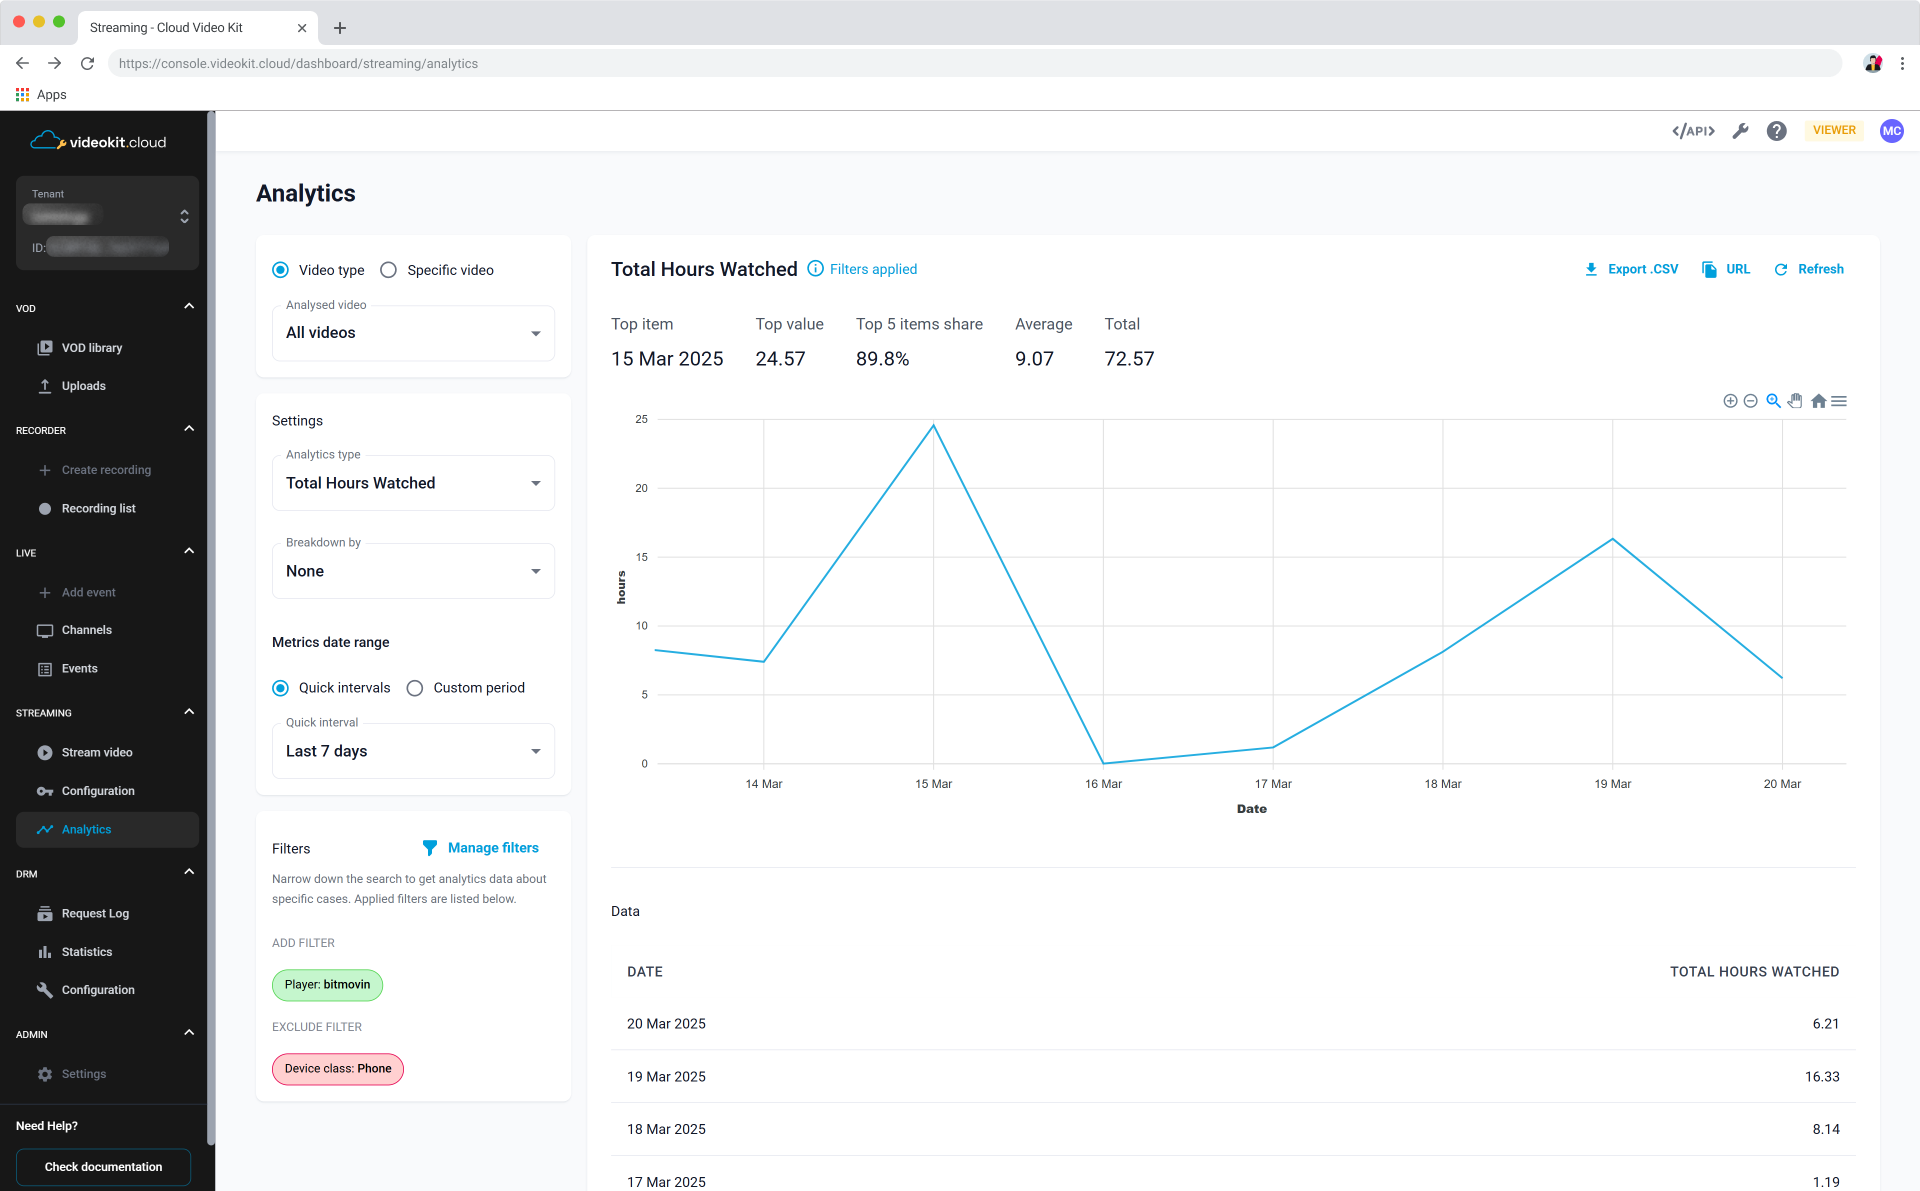
Working with Results
Line chart report
The line chart view provide interactive zoom, period selection, and view reset capabilities.
Hover over any data point in the graphs to see detailed information for that specific moment in time.

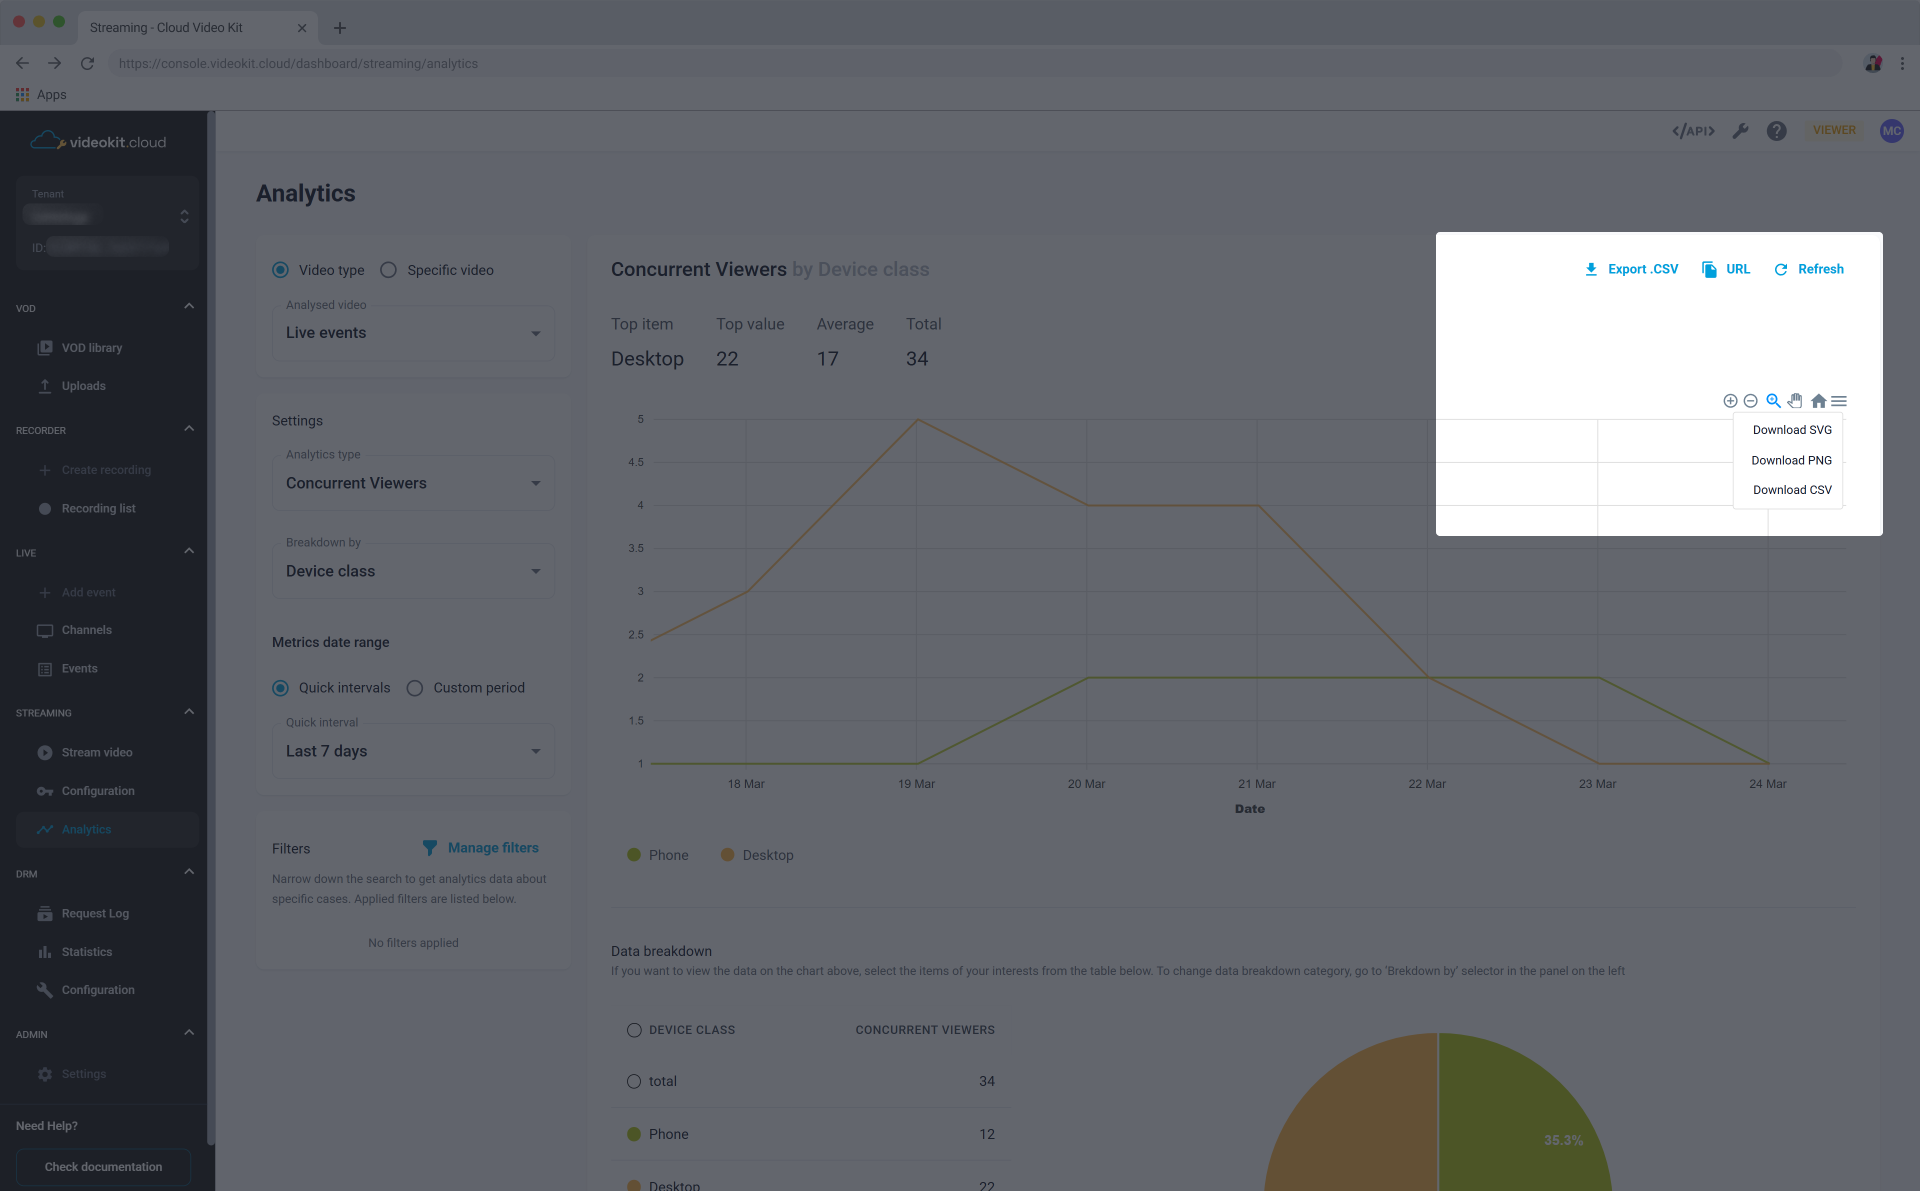
Exporting Options
Use the Export .CSV button to download raw report data.
The URL button copies a direct link to report view.
Click Refresh to reload the report with new data.
With the ☰ button on top of your report you can export analytics data in multiple formats:
- CSV download for raw data analysis
- SVG download for vector graphics
- PNG download for image sharing
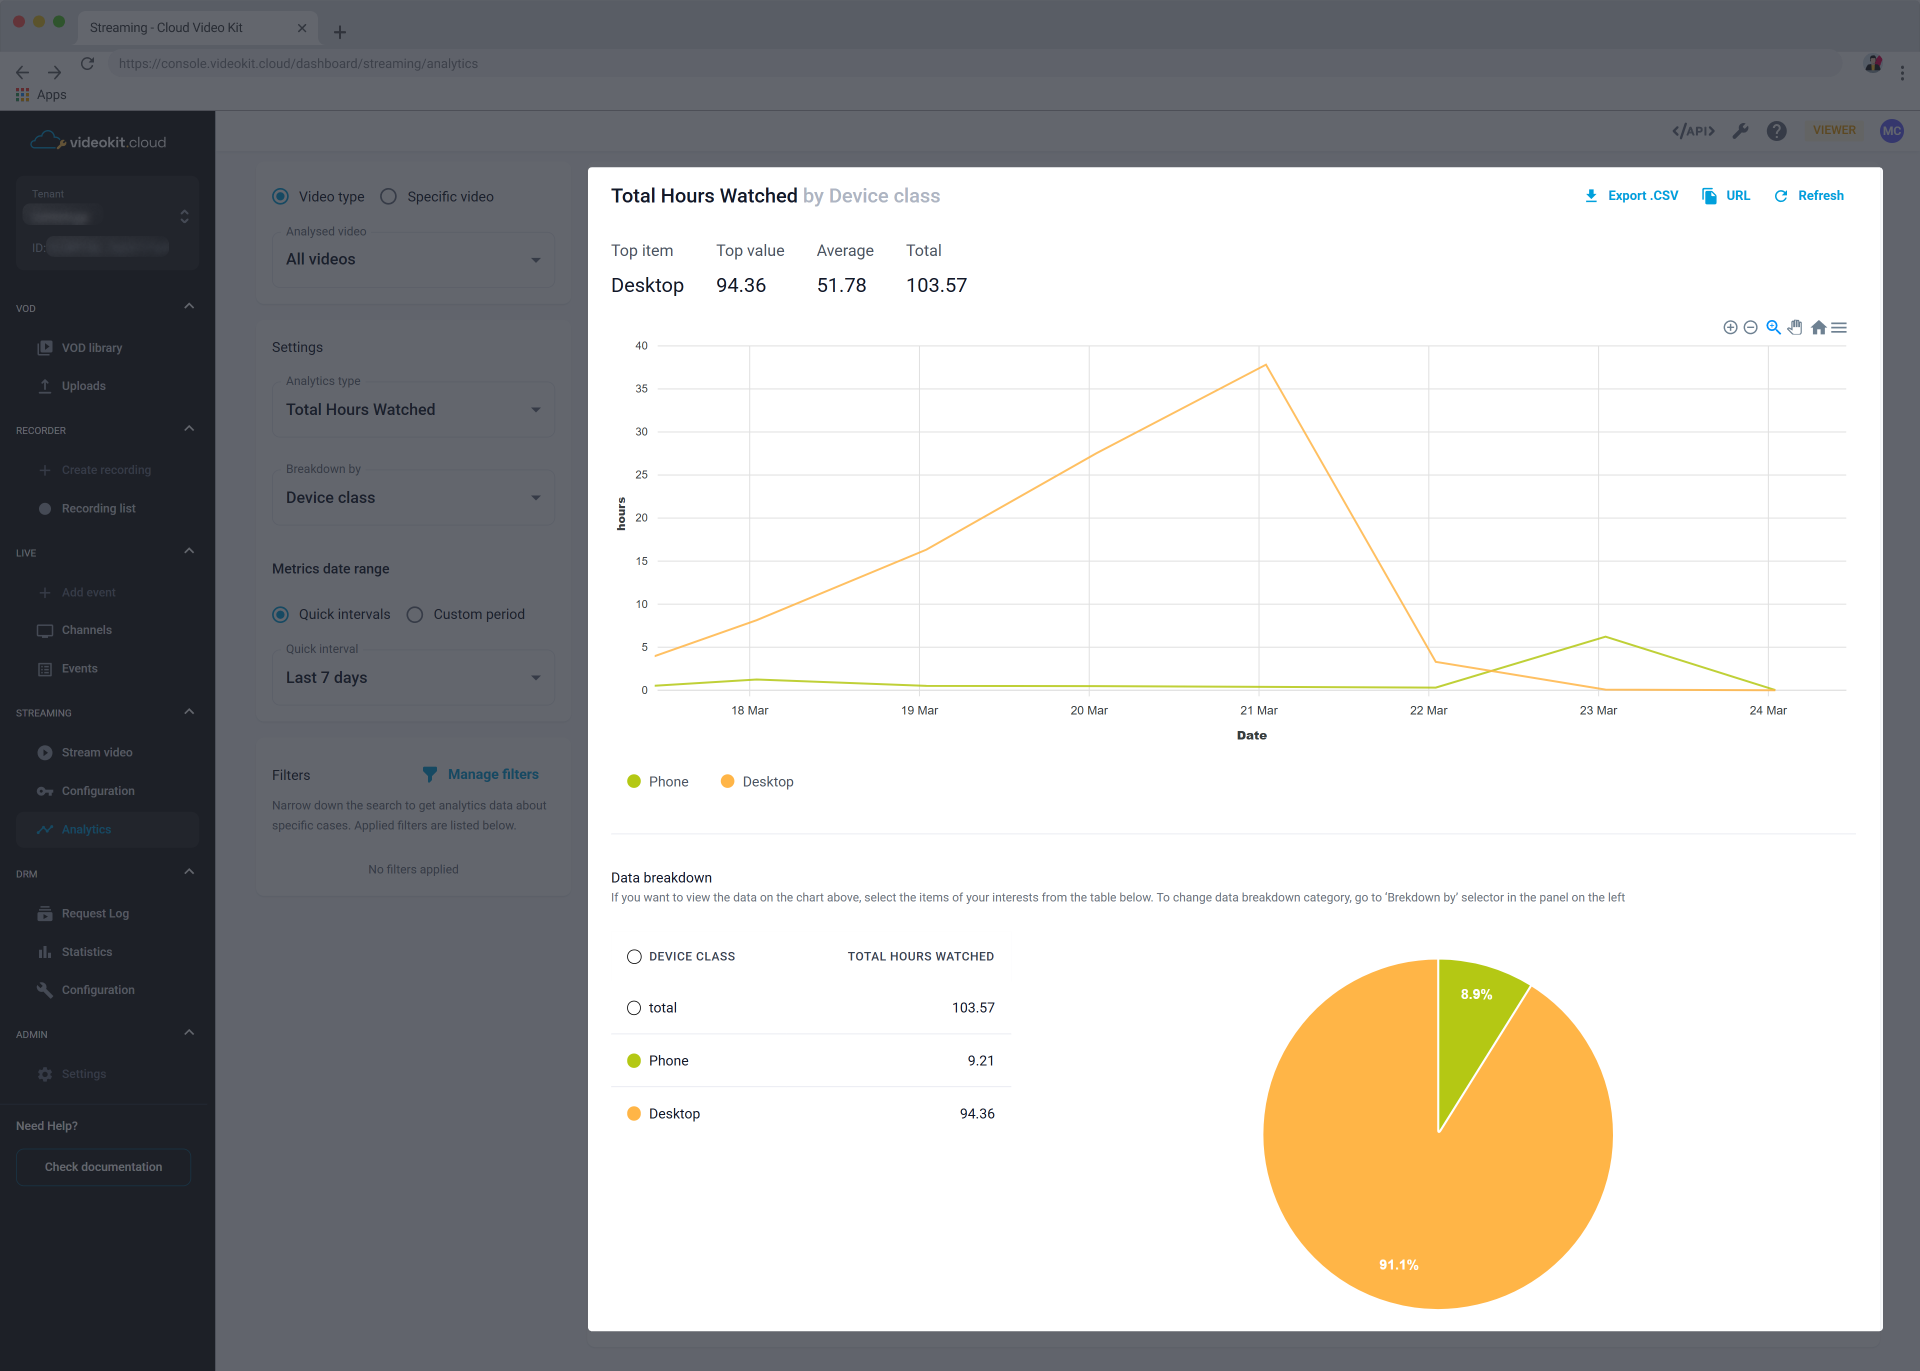
Data breakdown
The data breakdown section below your line chart shows a pie chart visualization of your analytics data segmented by your chosen categories. Results can be filtered and it will be immediately reflected on the line chart.