DRM Dashboard
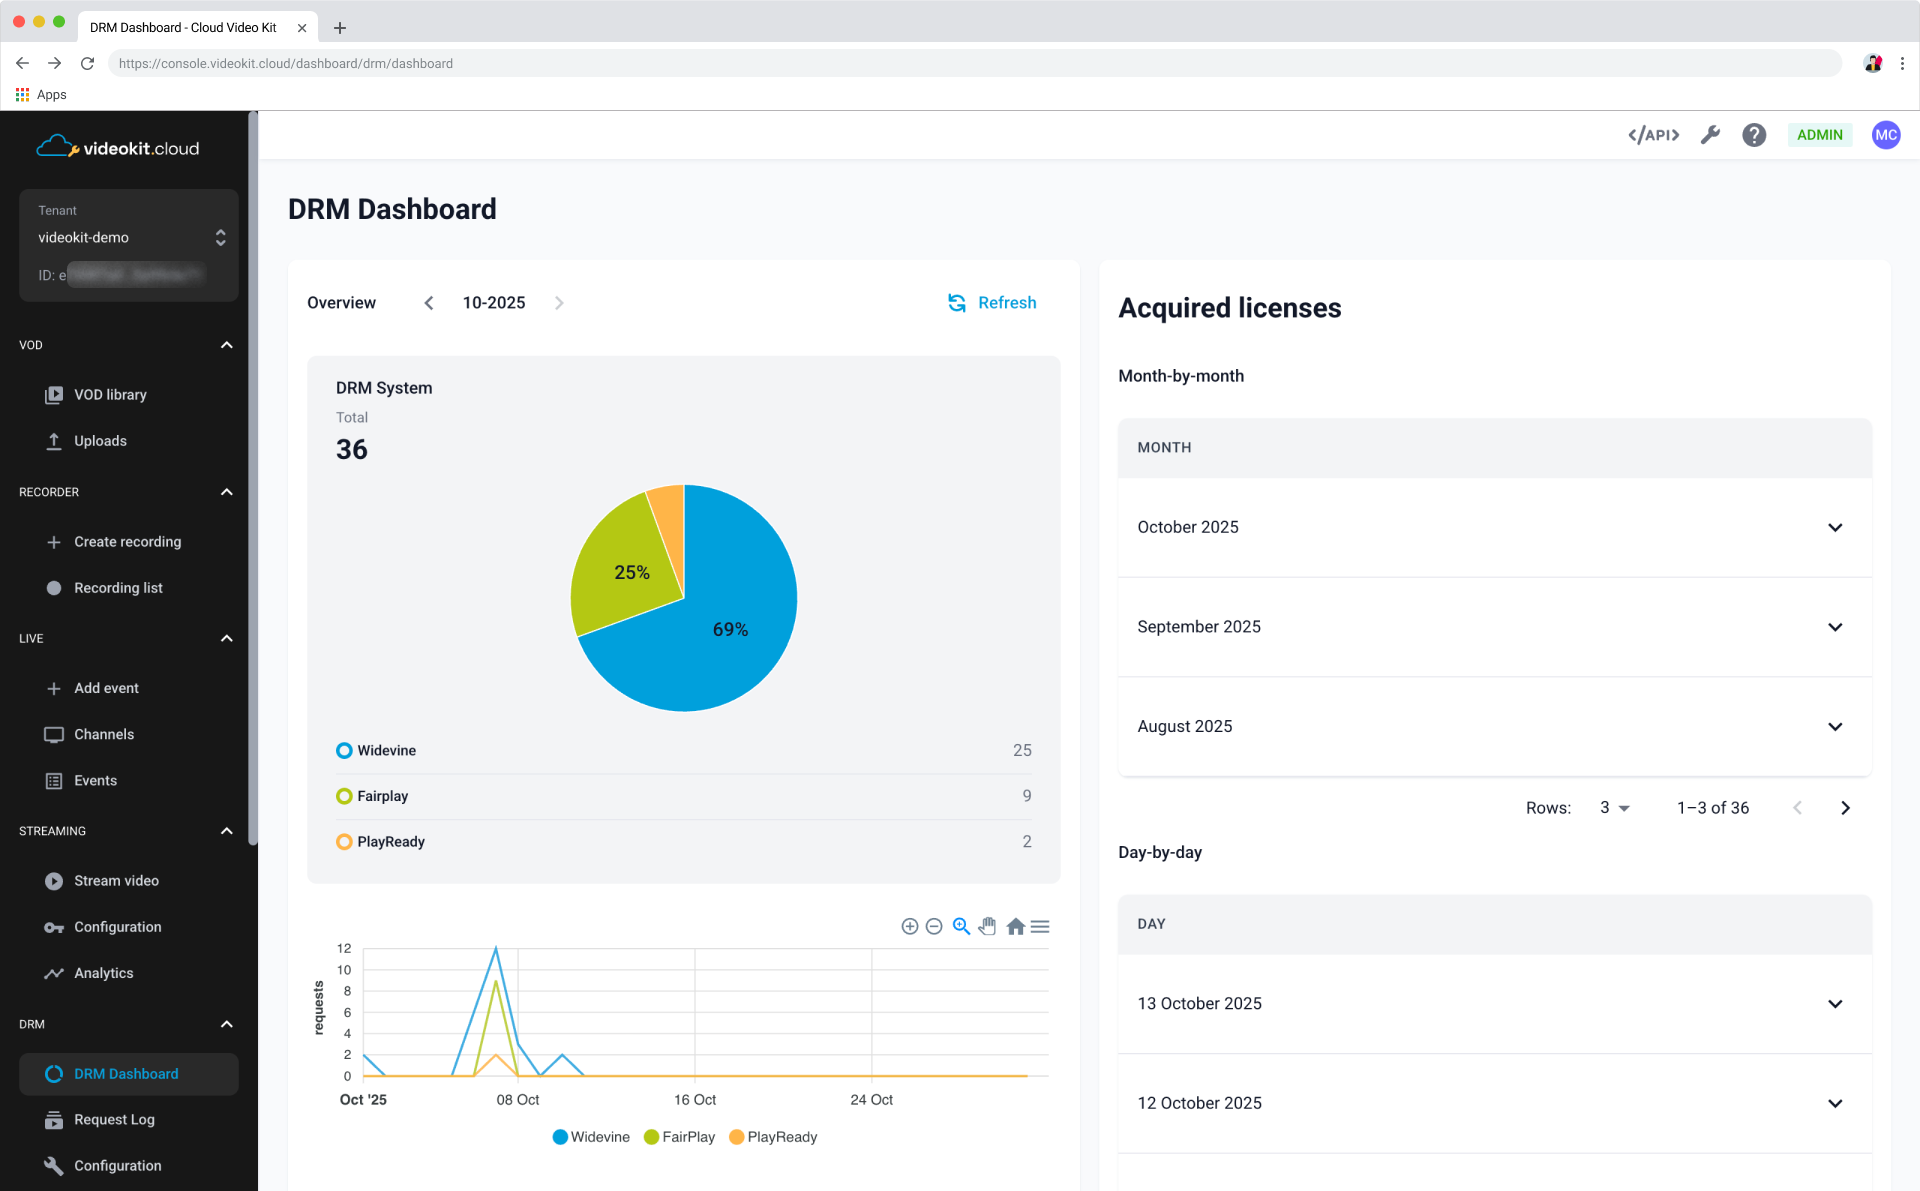
The DRM Dashboard provides a comprehensive overview of the Digital Rights Management (DRM) system performance and license acquisition within the Cloud Video Kit Console. It enables monitoring of license usage, device types, platforms, and error codes.
Overview
The overview section gives you an immediate look at the current status and metrics of the DRM system.
Key Metrics and Visualization
The main metrics are displayed prominently:
- DRM System: Shows the total count of DRM requests made in the selected time period.
- Graph: A time-series graph visualizes the daily activity of the DRM system. You can switch between different metrics like Widevine, PlayReady, and FairPlay to see their individual trends over the selected time period.
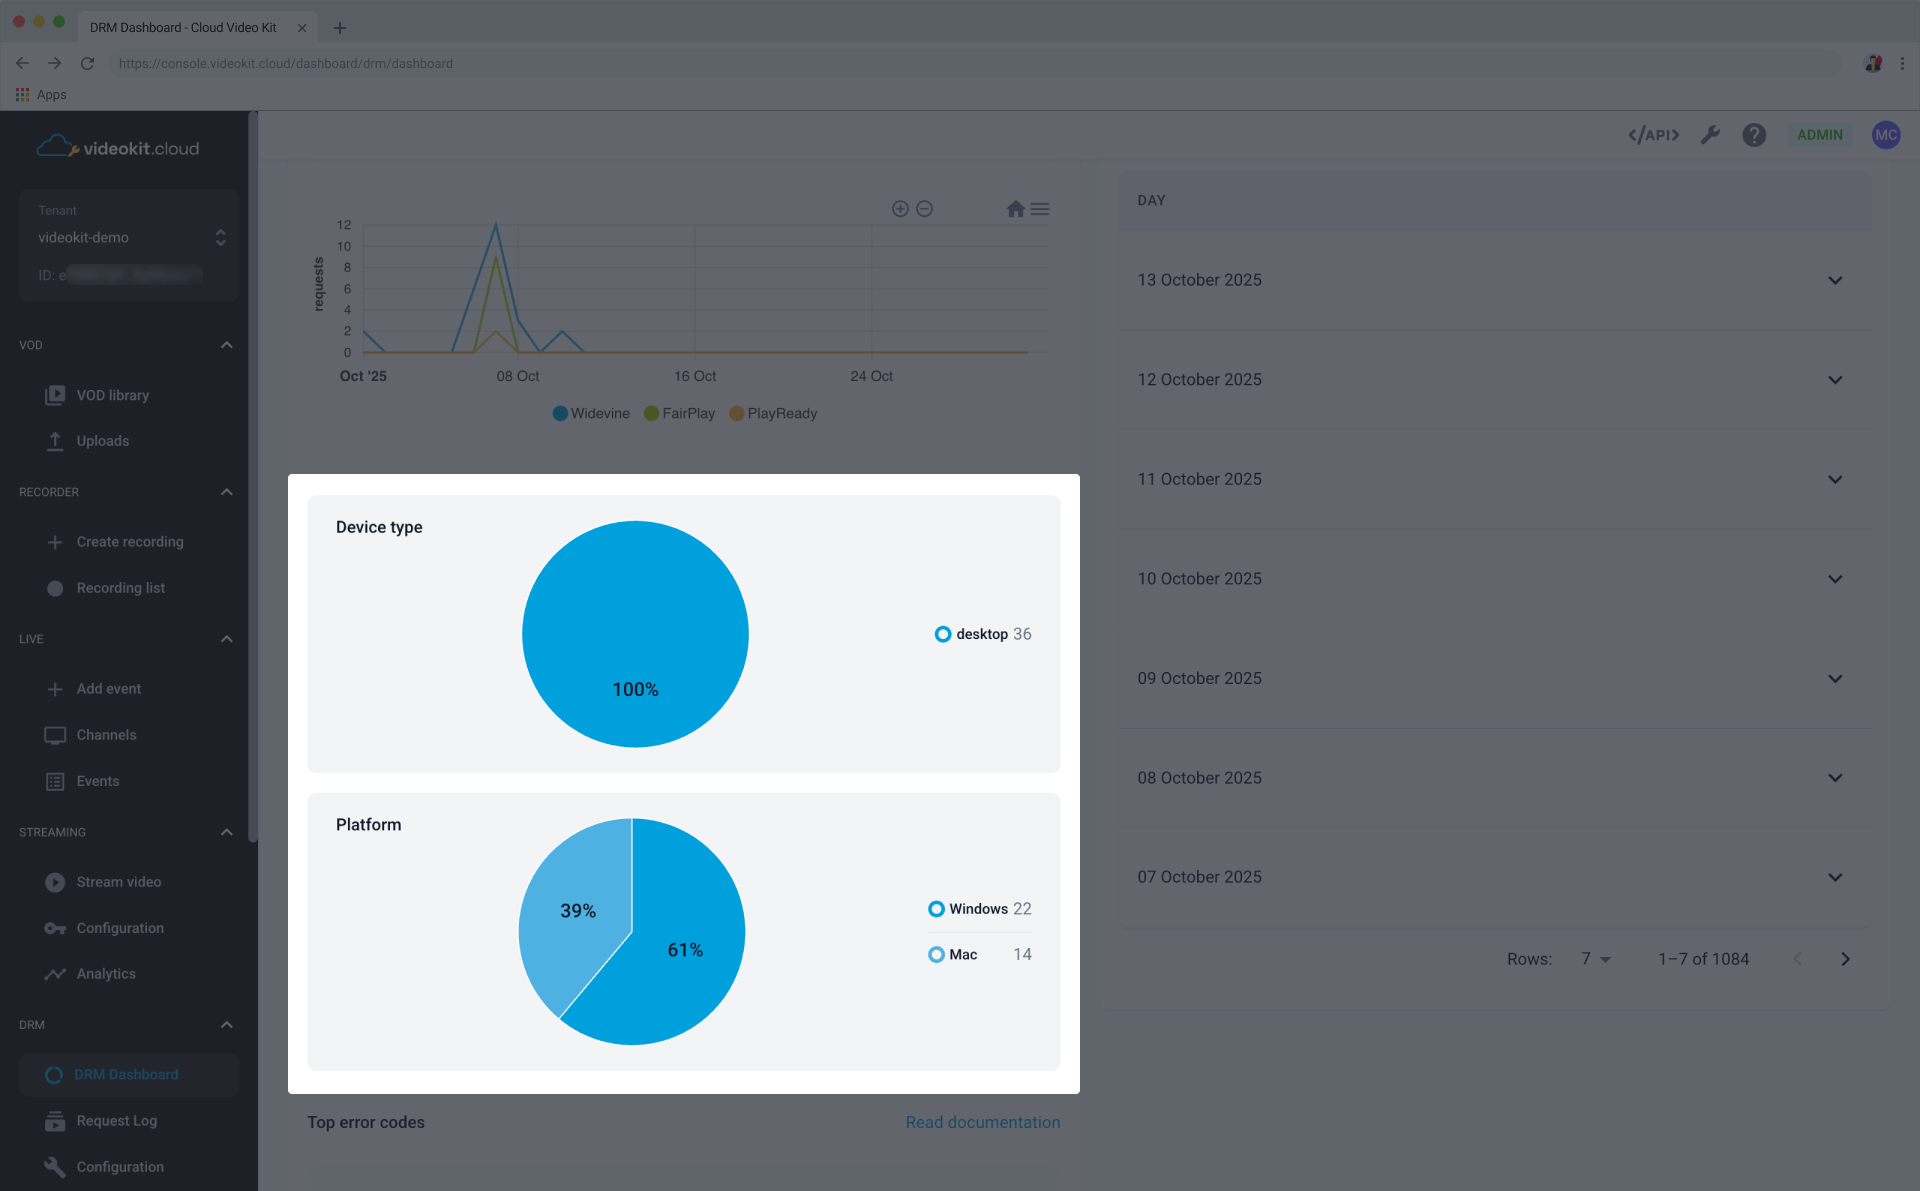
Device Type and Platform
These sections help you understand how and where your content is being consumed.
Device type graph
Shows the distribution of acquired licenses based on the type of device used by the end user.
Platform graph
Shows the distribution of acquired licenses across different operating systems or environments.
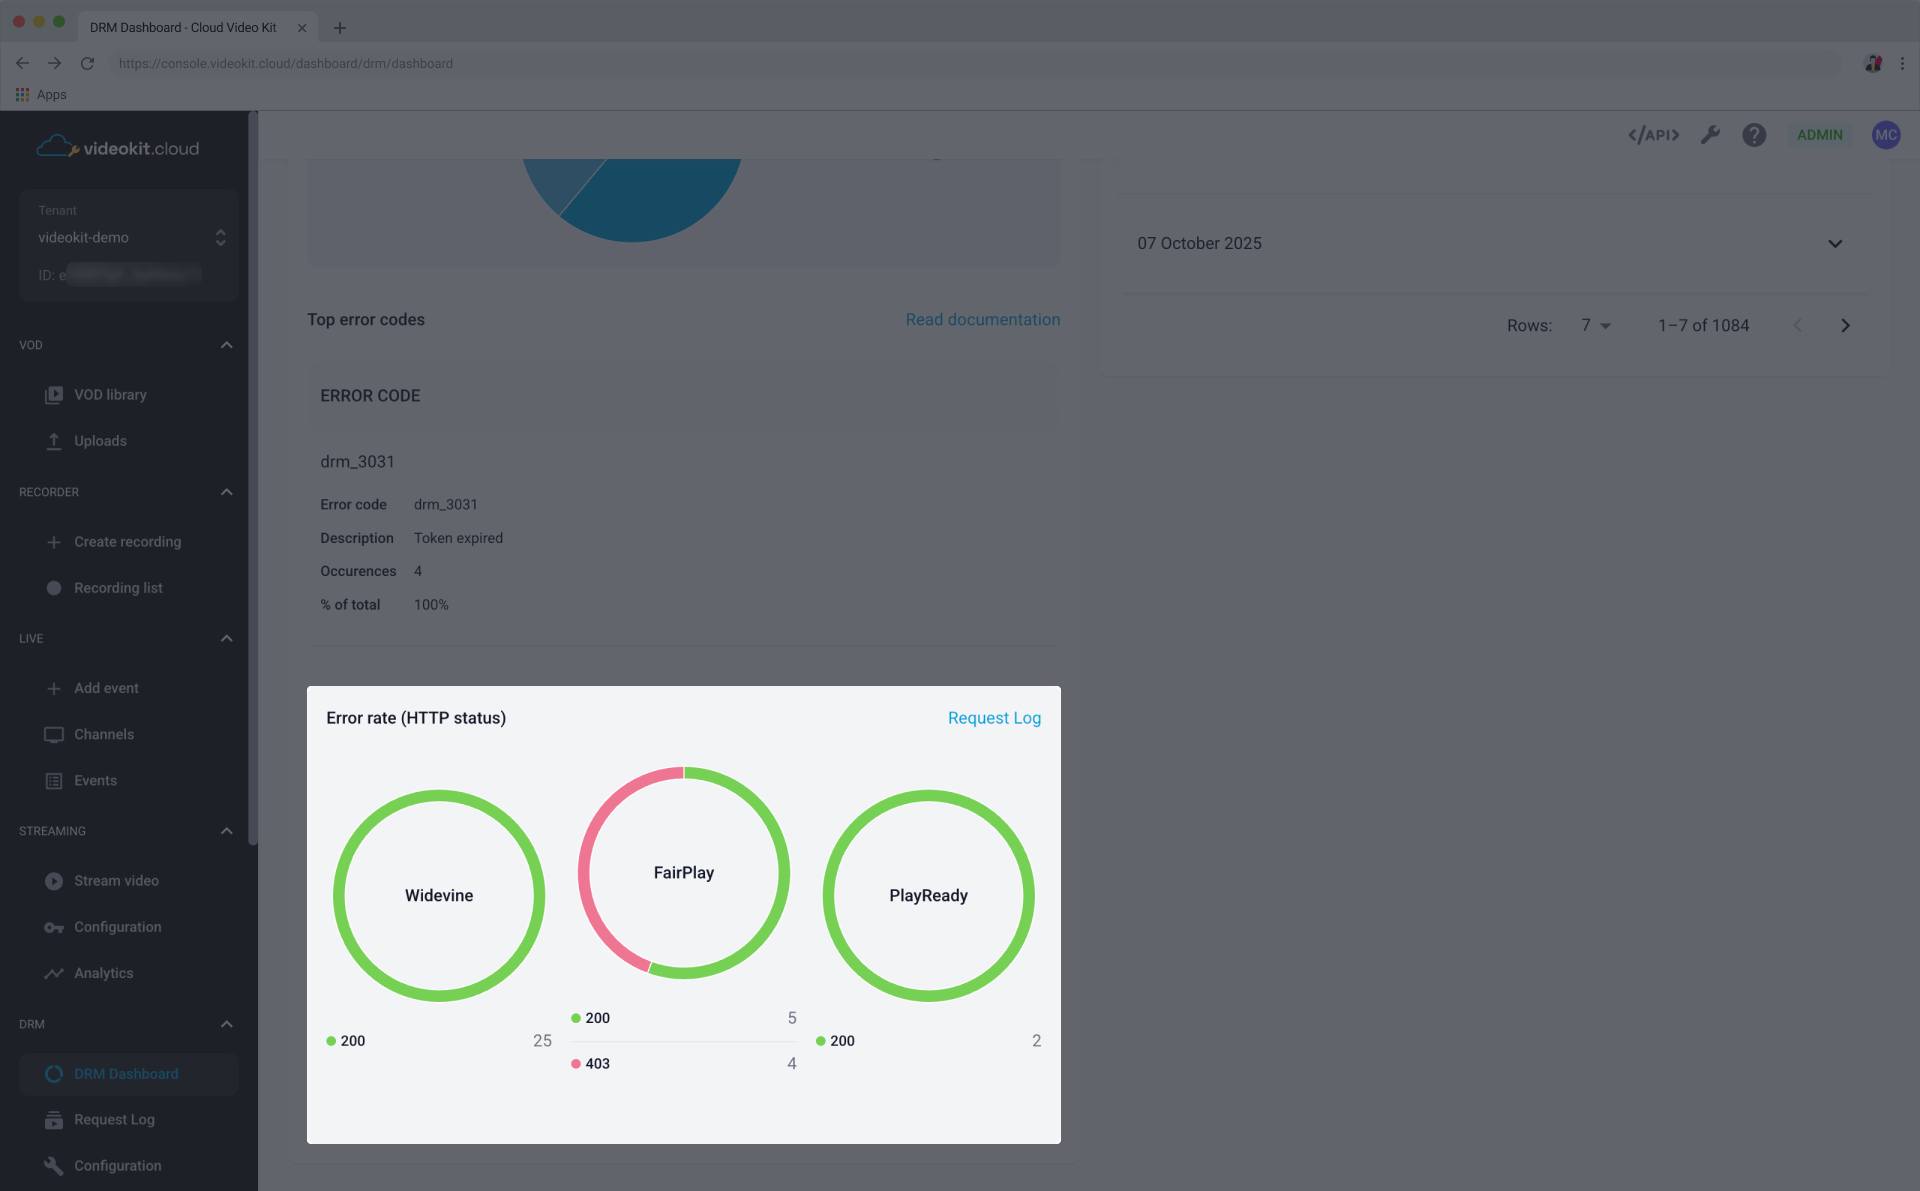
Top Error Codes
This section highlights the most frequent errors encountered, which is critical for troubleshooting and improving system reliability.
The table lists:
- Error code: The specific DRM error code (e.g., drm_3031, drm_3032).
- Description: A brief explanation of the error (e.g., Error expired, License expired).
- Occurrences: A total number of occurrences of the described error over the selected time period.
- % of total: The percentage of all reported errors this specific code accounts for.
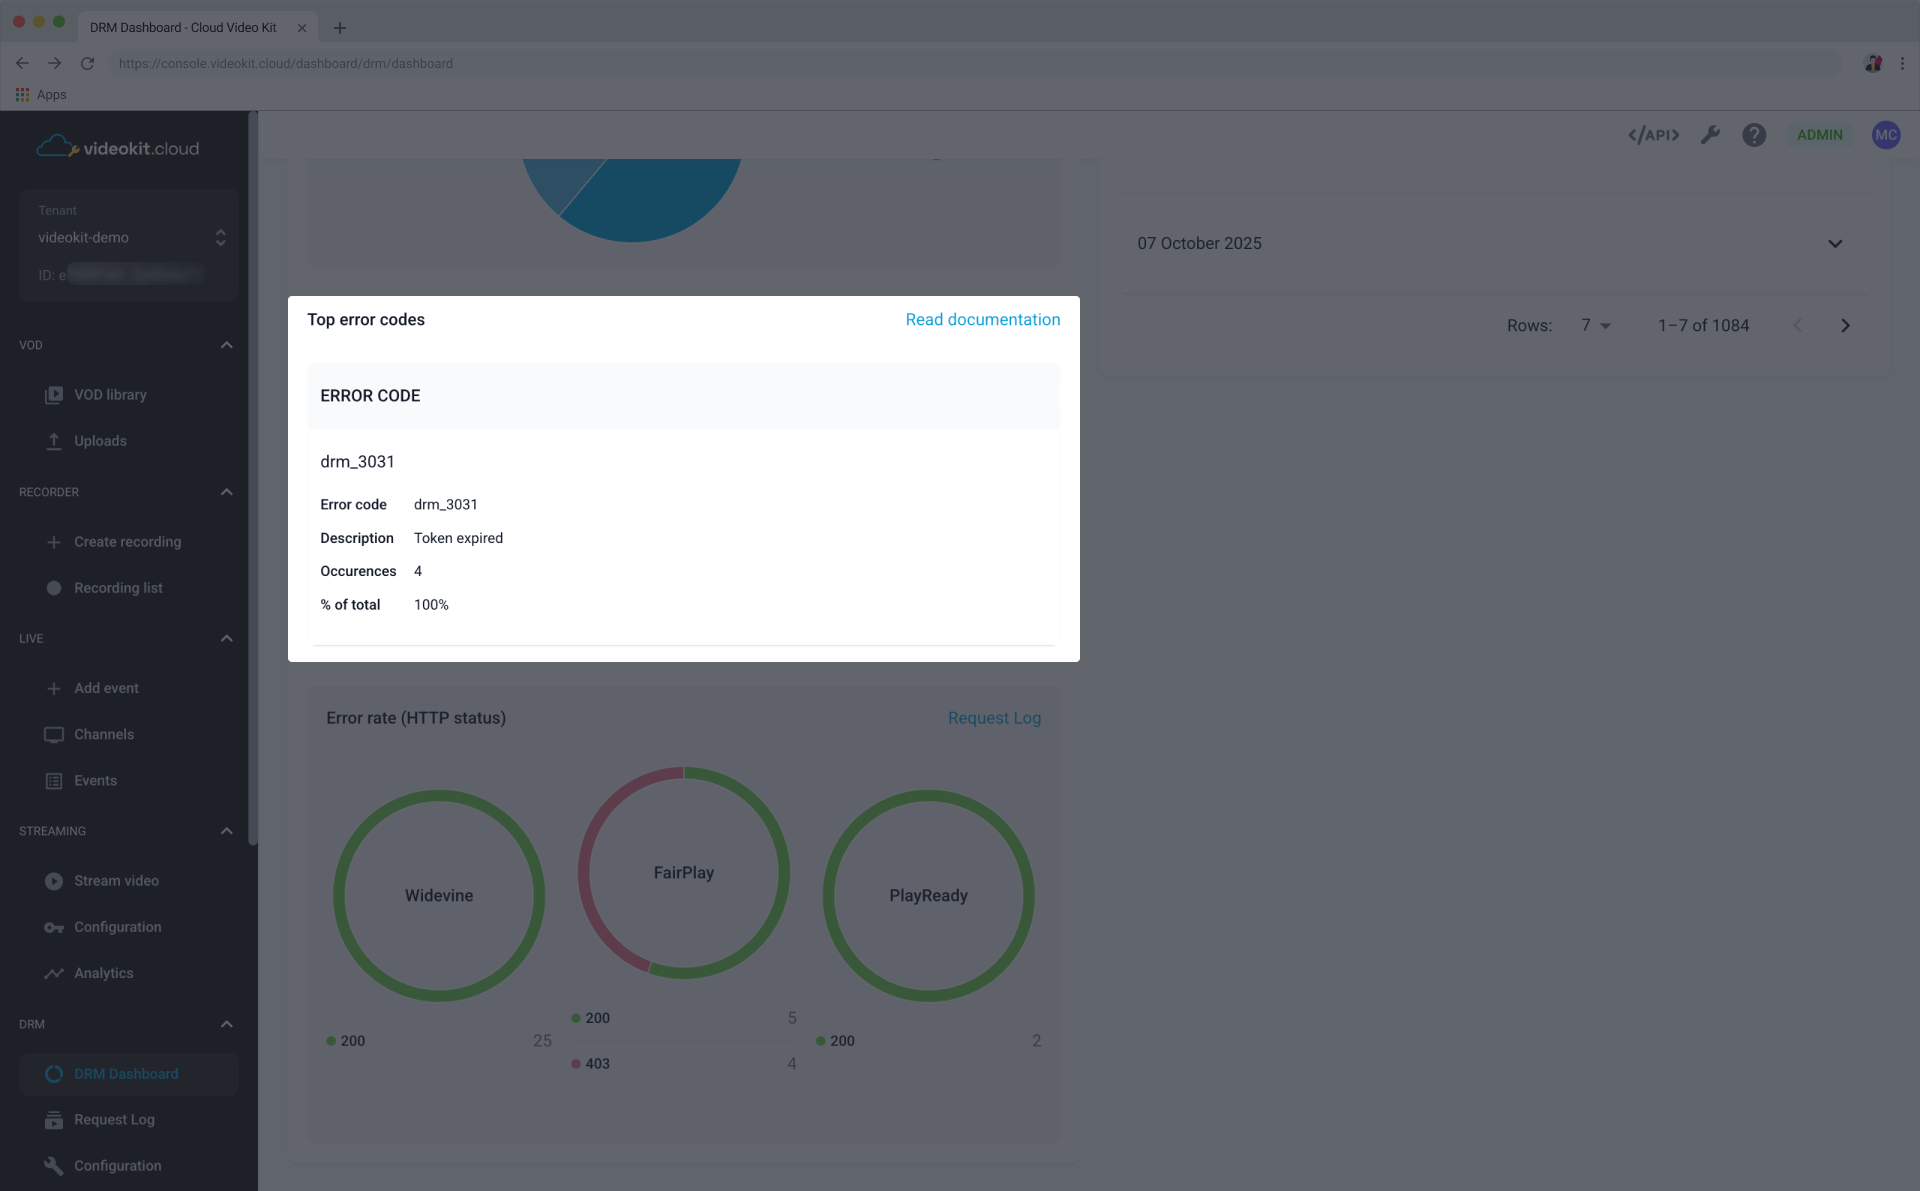
Error Rate (HTTP status)
This section focuses on errors reported via HTTP status codes, divided by platform.
The graphs display:
- HTTP Status Code: (e.g., 200, 403).
- Count: The number of times that status code was returned.
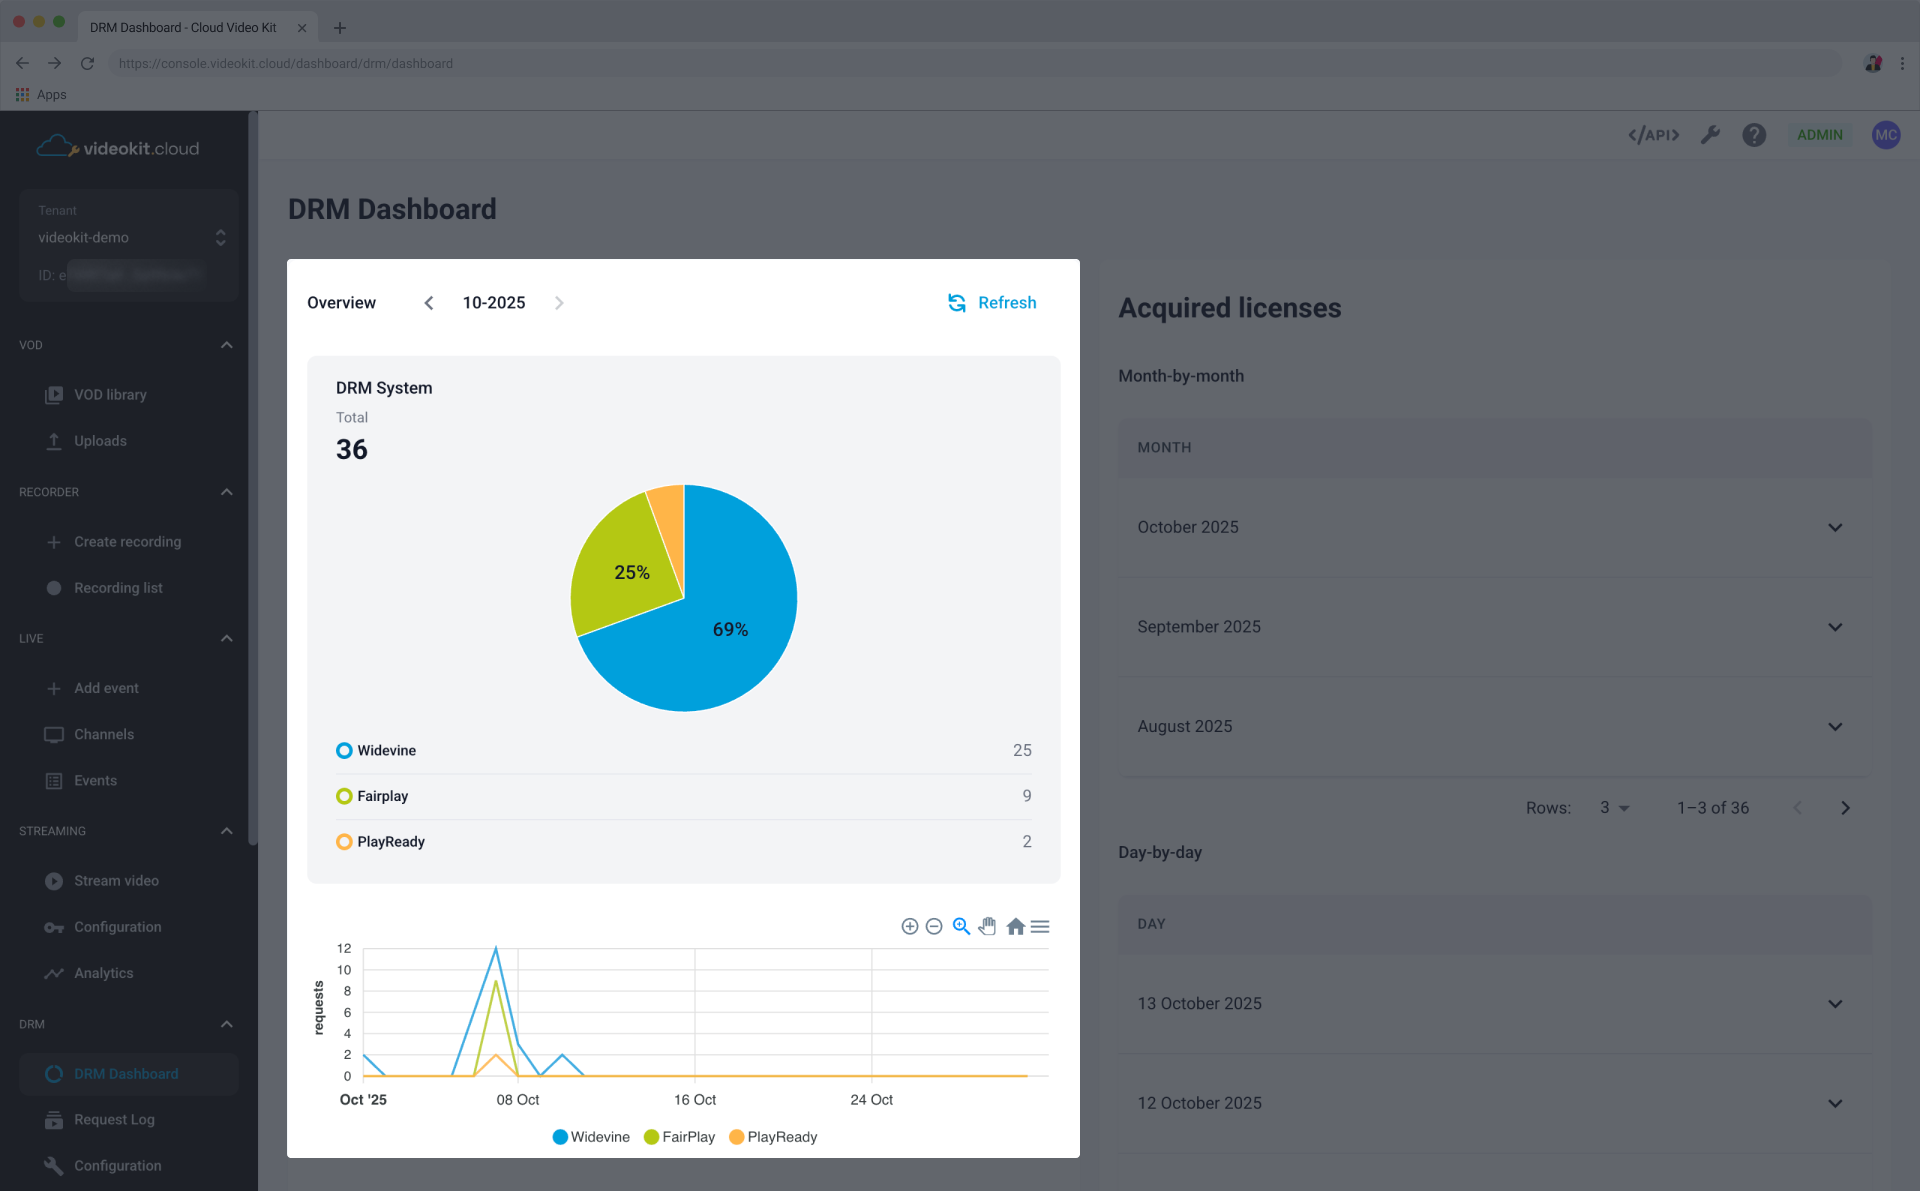
Acquired Licenses
This section details the volume of acquired licenses, broken down by month and by day. This helps track usage patterns and licensing costs.
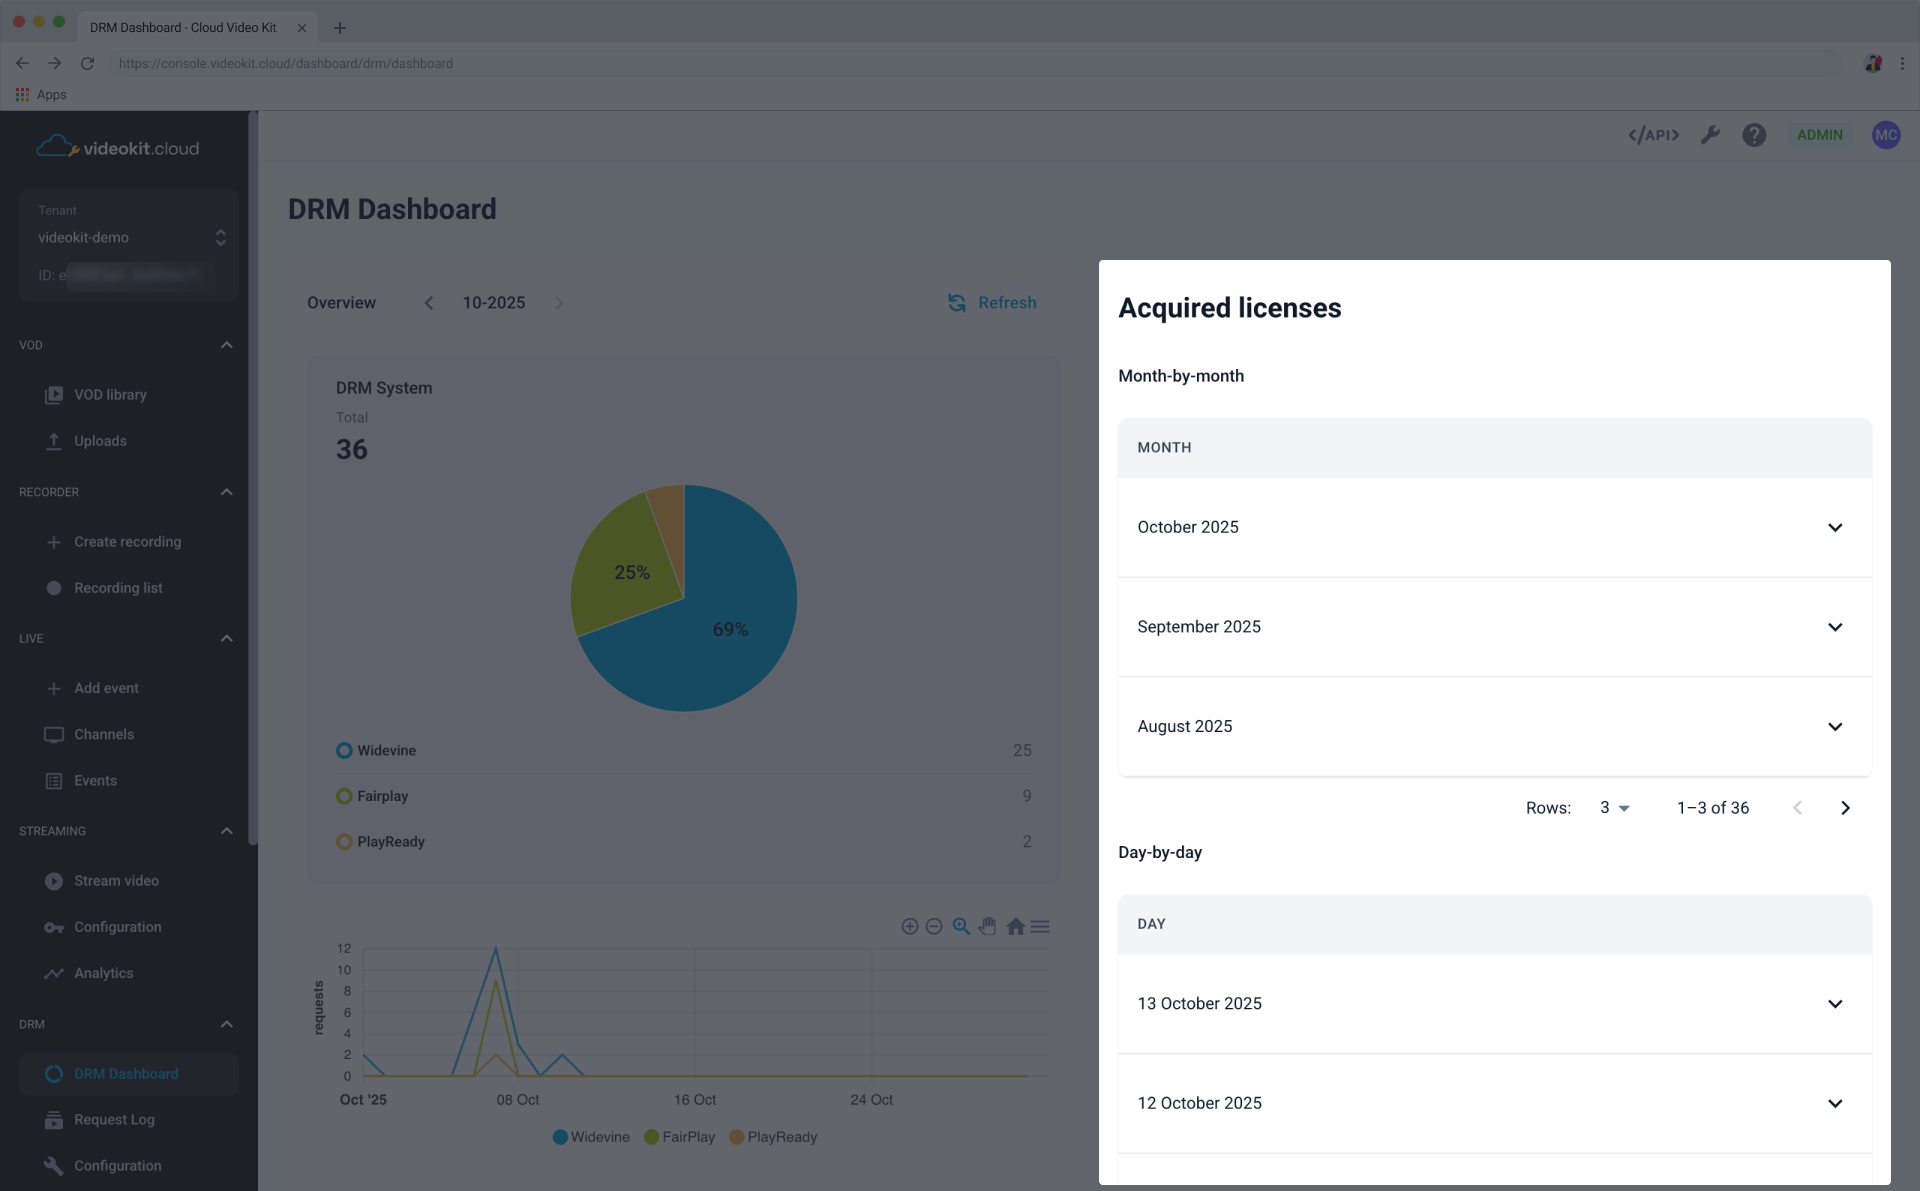
Month-by-month
This view allows you to see the license acquisition totals for current and previous months.
You can expand each month to see more granular details.
Day-by-day
This view provides a daily breakdown of acquired licenses, which can be expanded to show further details for a specific day.
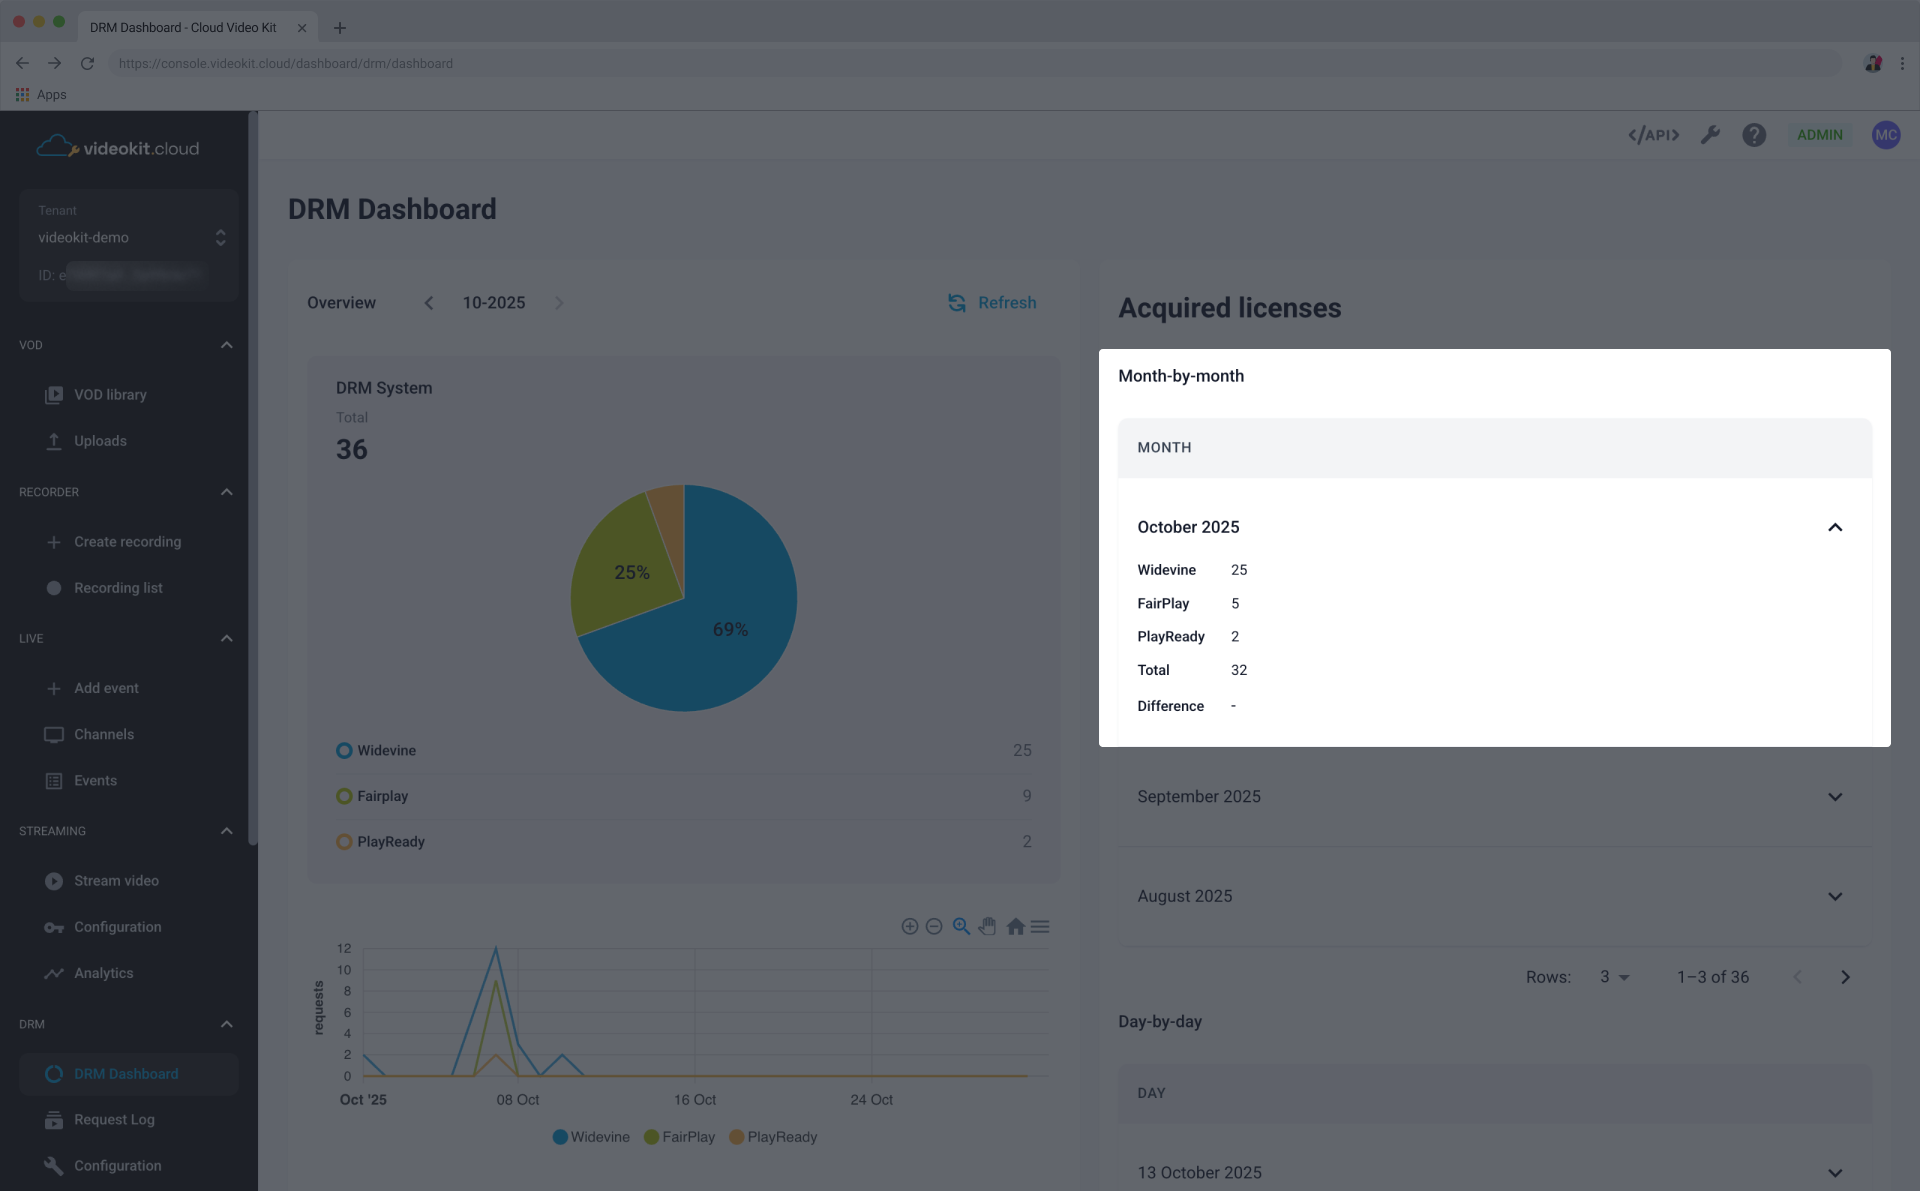
The Acquired Licenses section shows the number of licenses that were successfully granted, not all requests. Failed attempts caused by errors or invalid parameters are not included. This explains why the “Total” values may vary.