Request Log
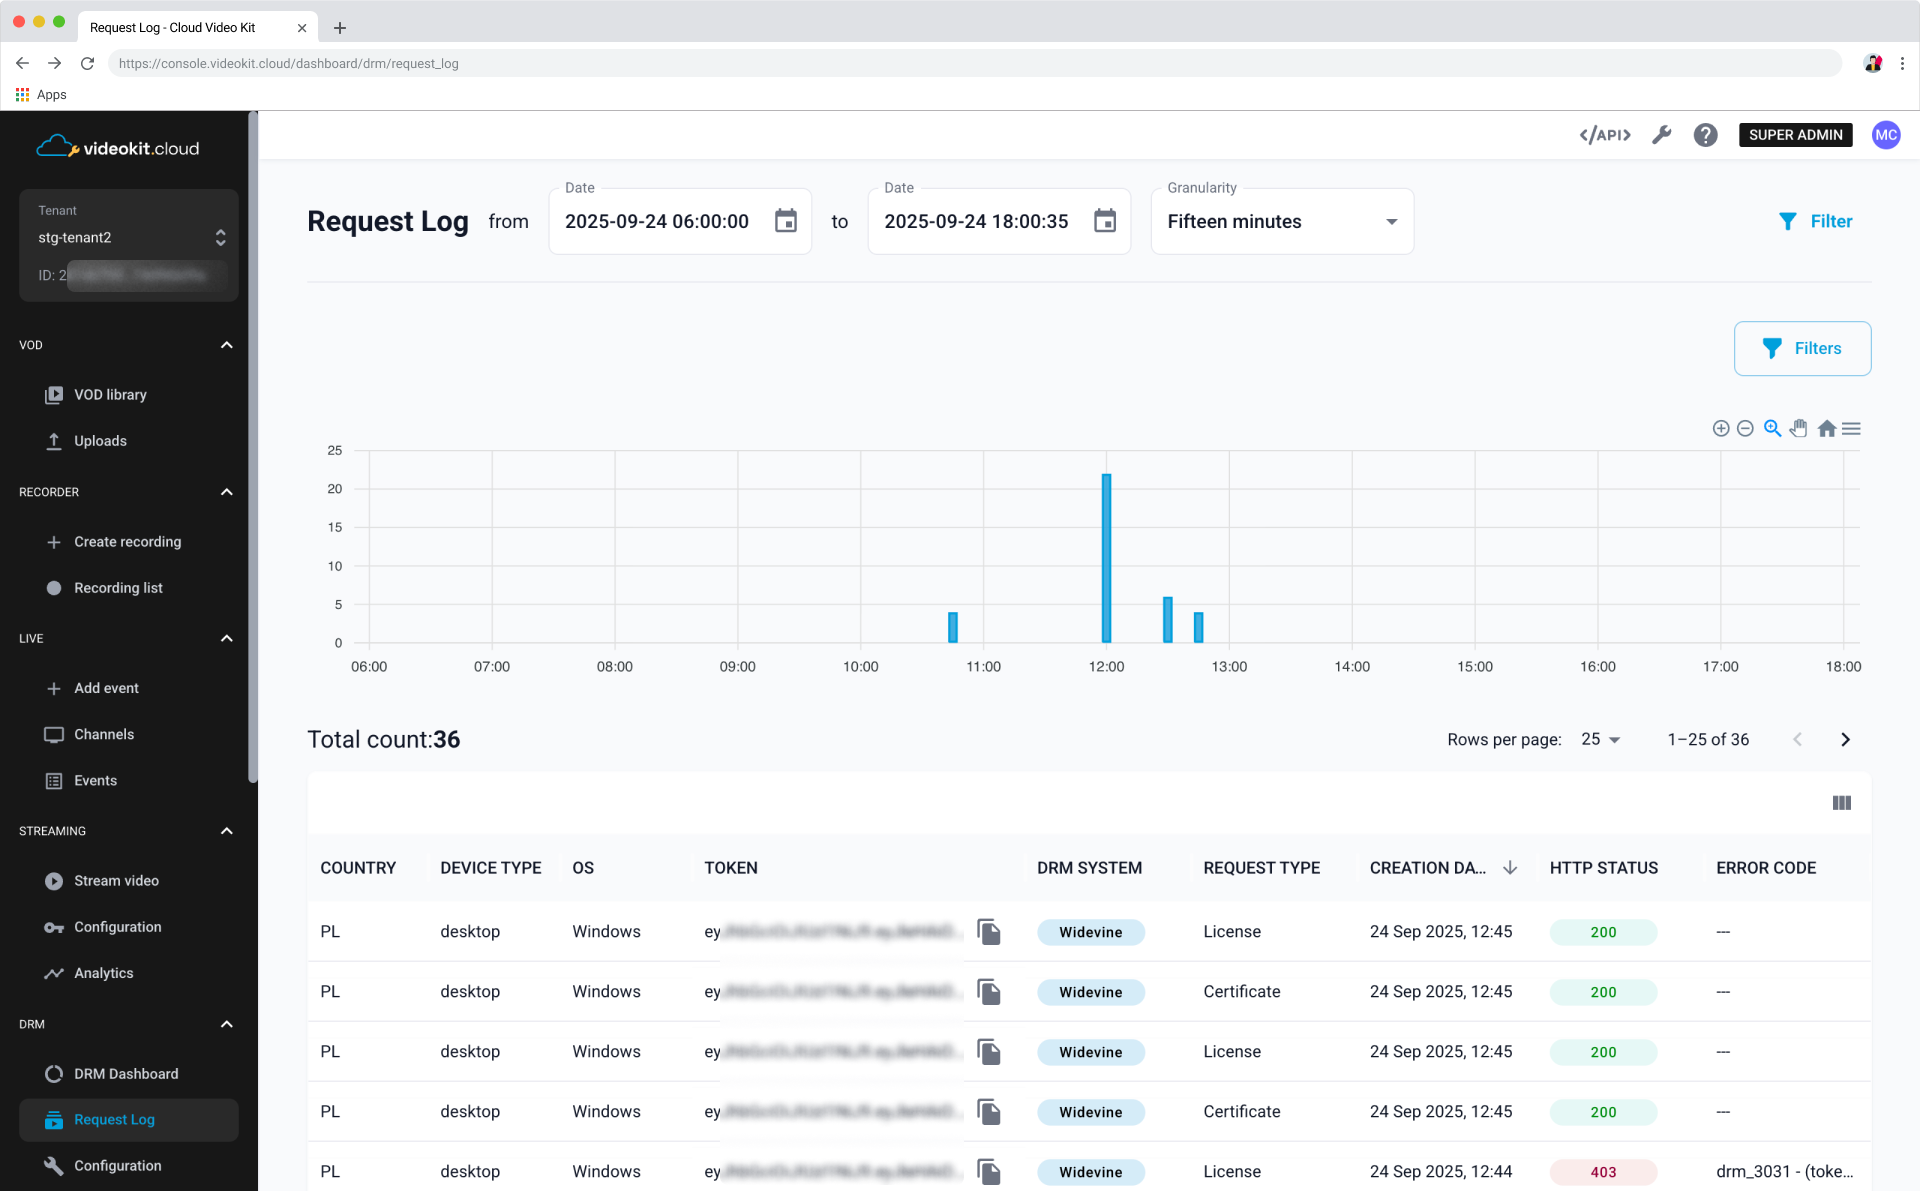
The Request Log view, provides a detailed, searchable, and visual record of all Digital Rights Management (DRM) requests received by the system. This view is essential for monitoring system activity and troubleshooting issues like license failures or errors.
Log Filters and Controls
The top section of the Request Log allows you to narrow down the displayed data using various controls and filters.
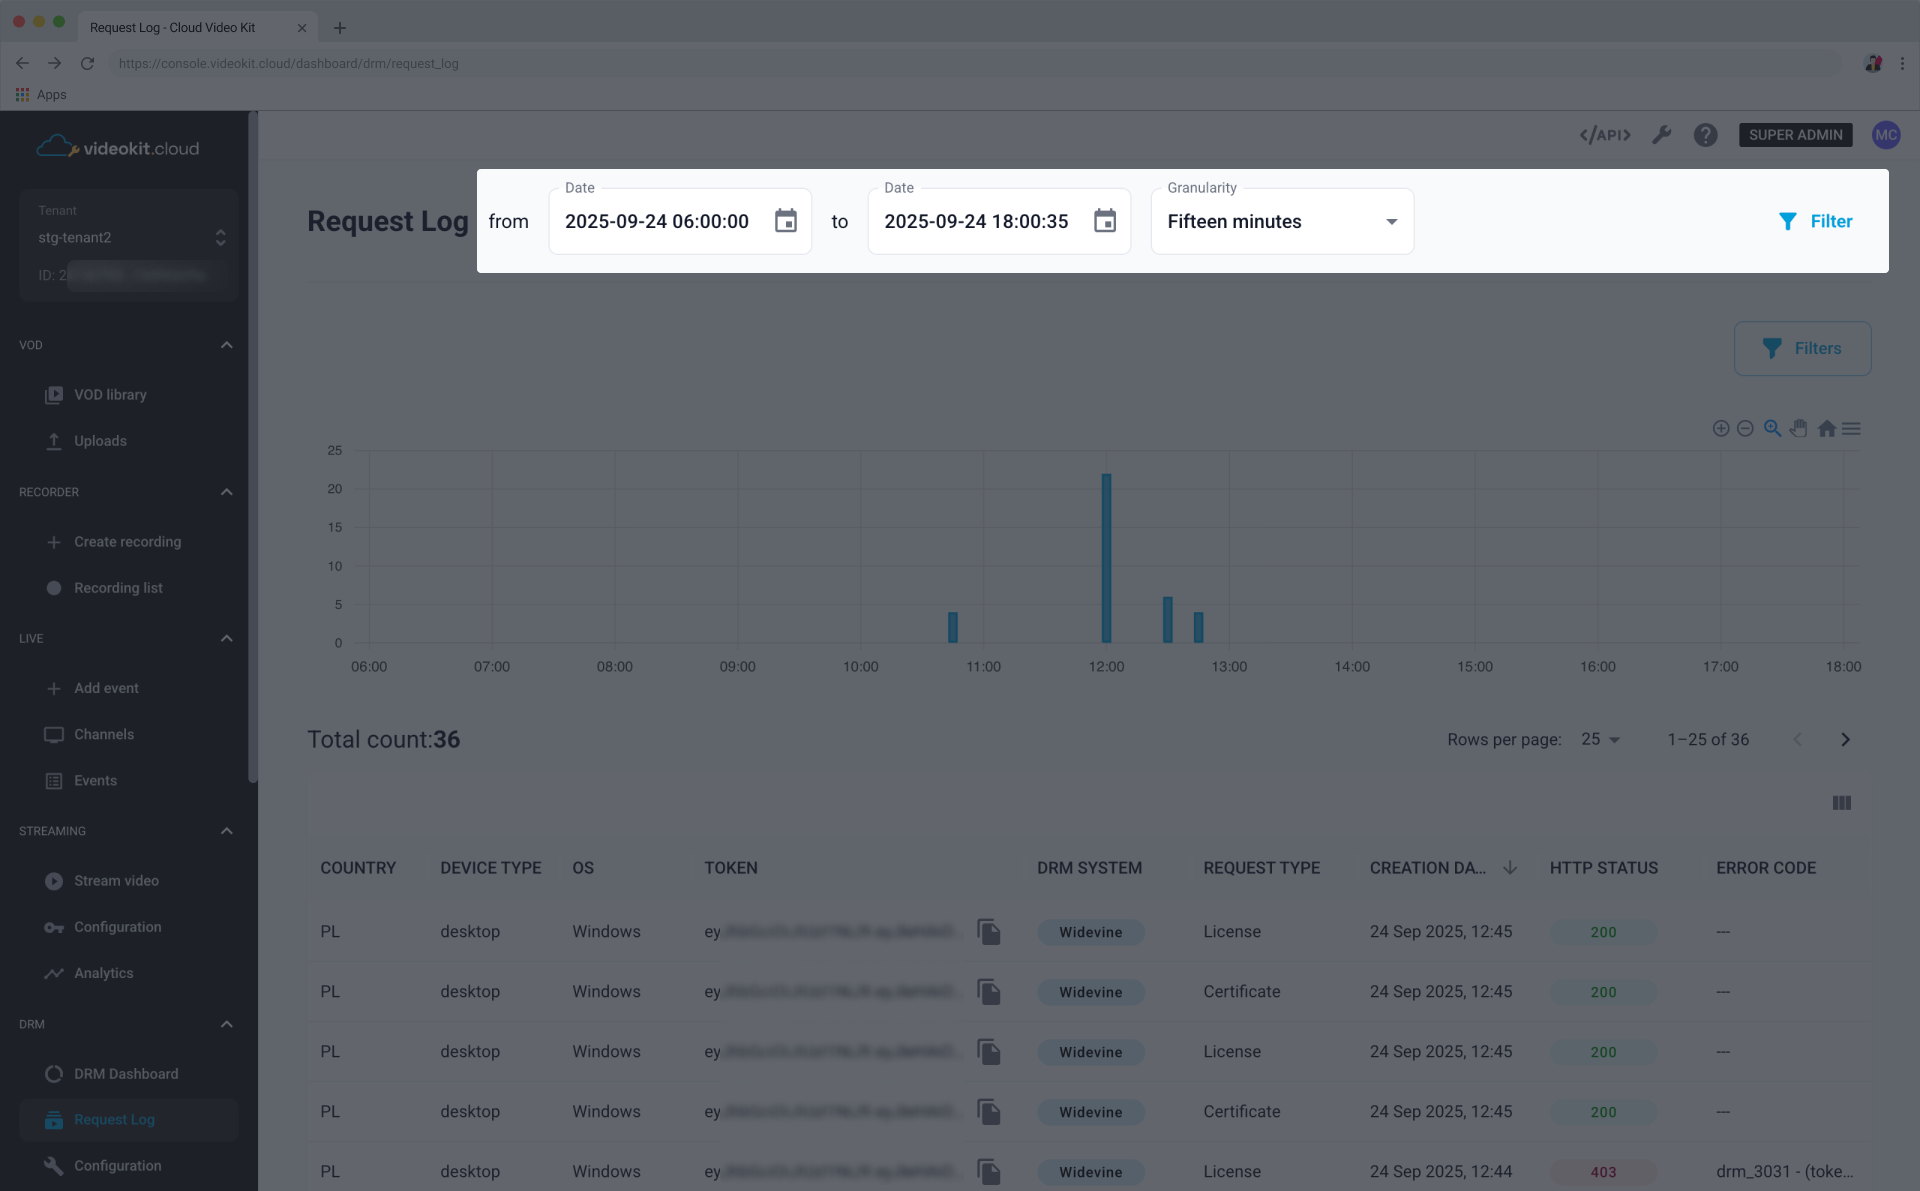
Date and Granulity Selection
- Date Range: Allows you to set a specific time frame for the log entries. The display includes a
fromdate/time (e.g.,2025-09-24 06:00:00) and atodate/time (e.g.,2025-09-24 18:00:35). - Granularity: Sets the interval for the data visualization in the graph, with an option like
Fifteen minutesselected in the example. - Filter: The
Filterbutton updates the log with the latest data based on the selected filters.
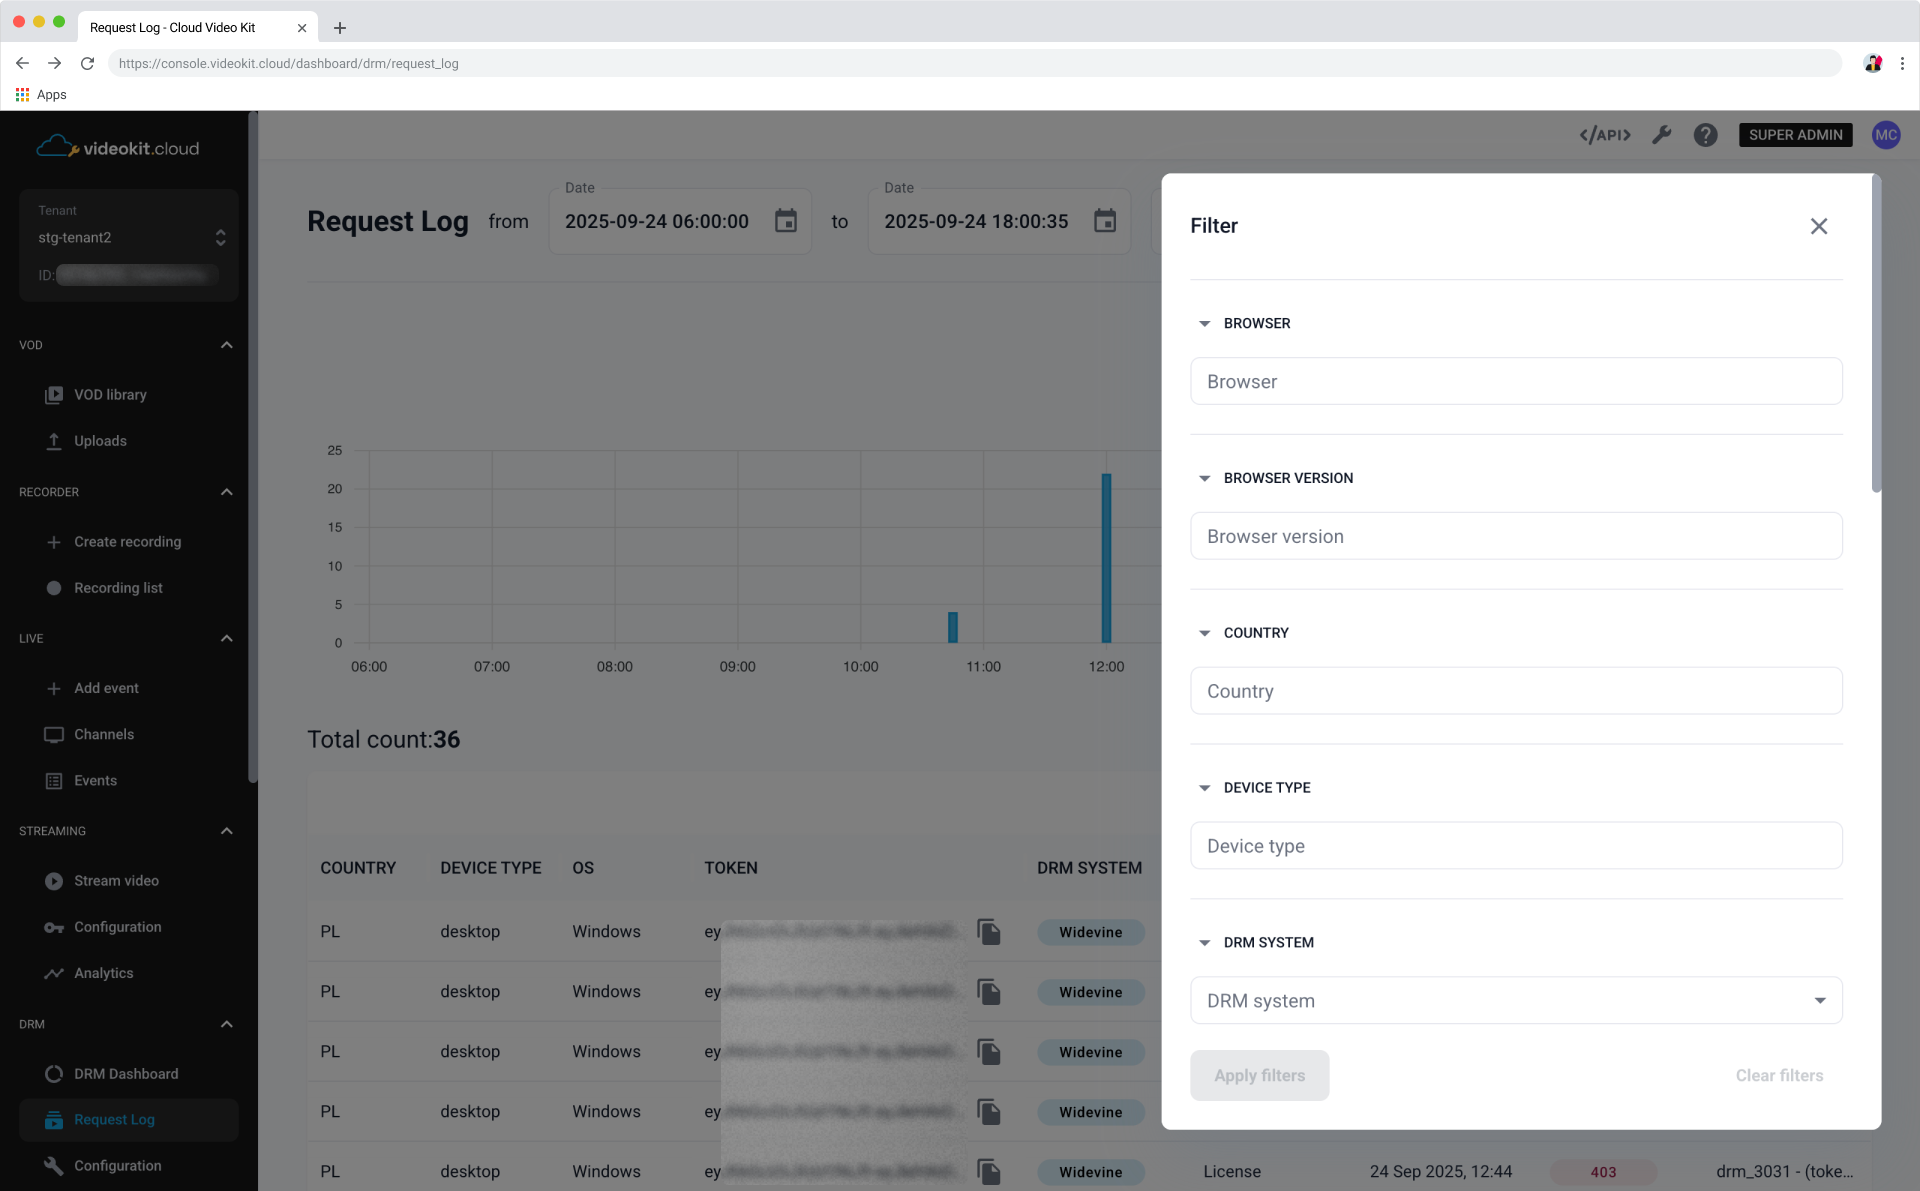
Filters
Filters: The Filters button allows you to apply additional criteria to narrow down the log entries.
Available filters are:
- Browser
- Browser version
- Country
- Device type
- DRM system
- Error code
- HTTP status
- ISP
- IP
- OS
- OS version
- Request type
- Token
- Token content ID
- Token user ID
- Brand
- Model
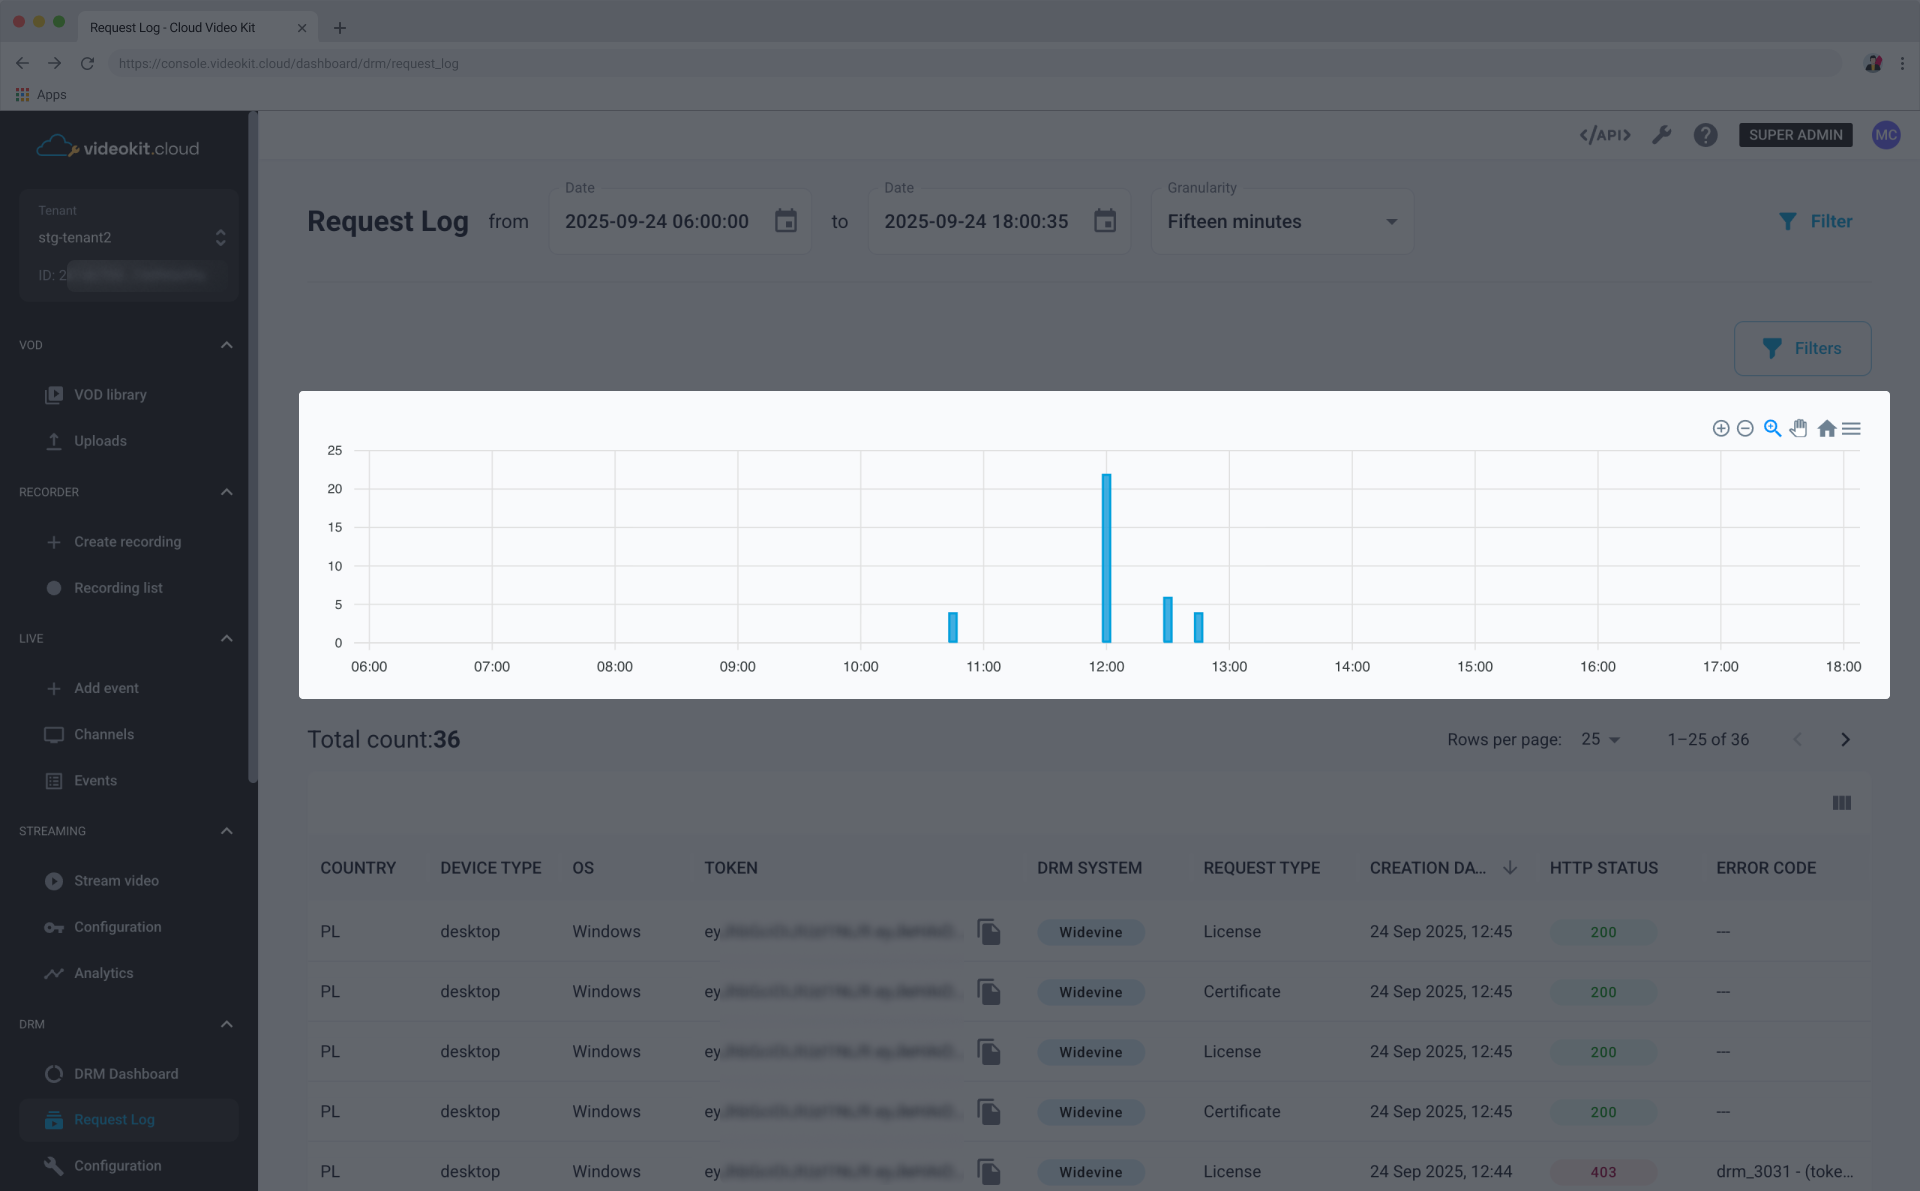
Log Visualization
Below the filters is a graph providing a visual representation of request activity over the selected time range and applied filters.
Request Log Table
The main section displays the detailed request log entries in a table format.
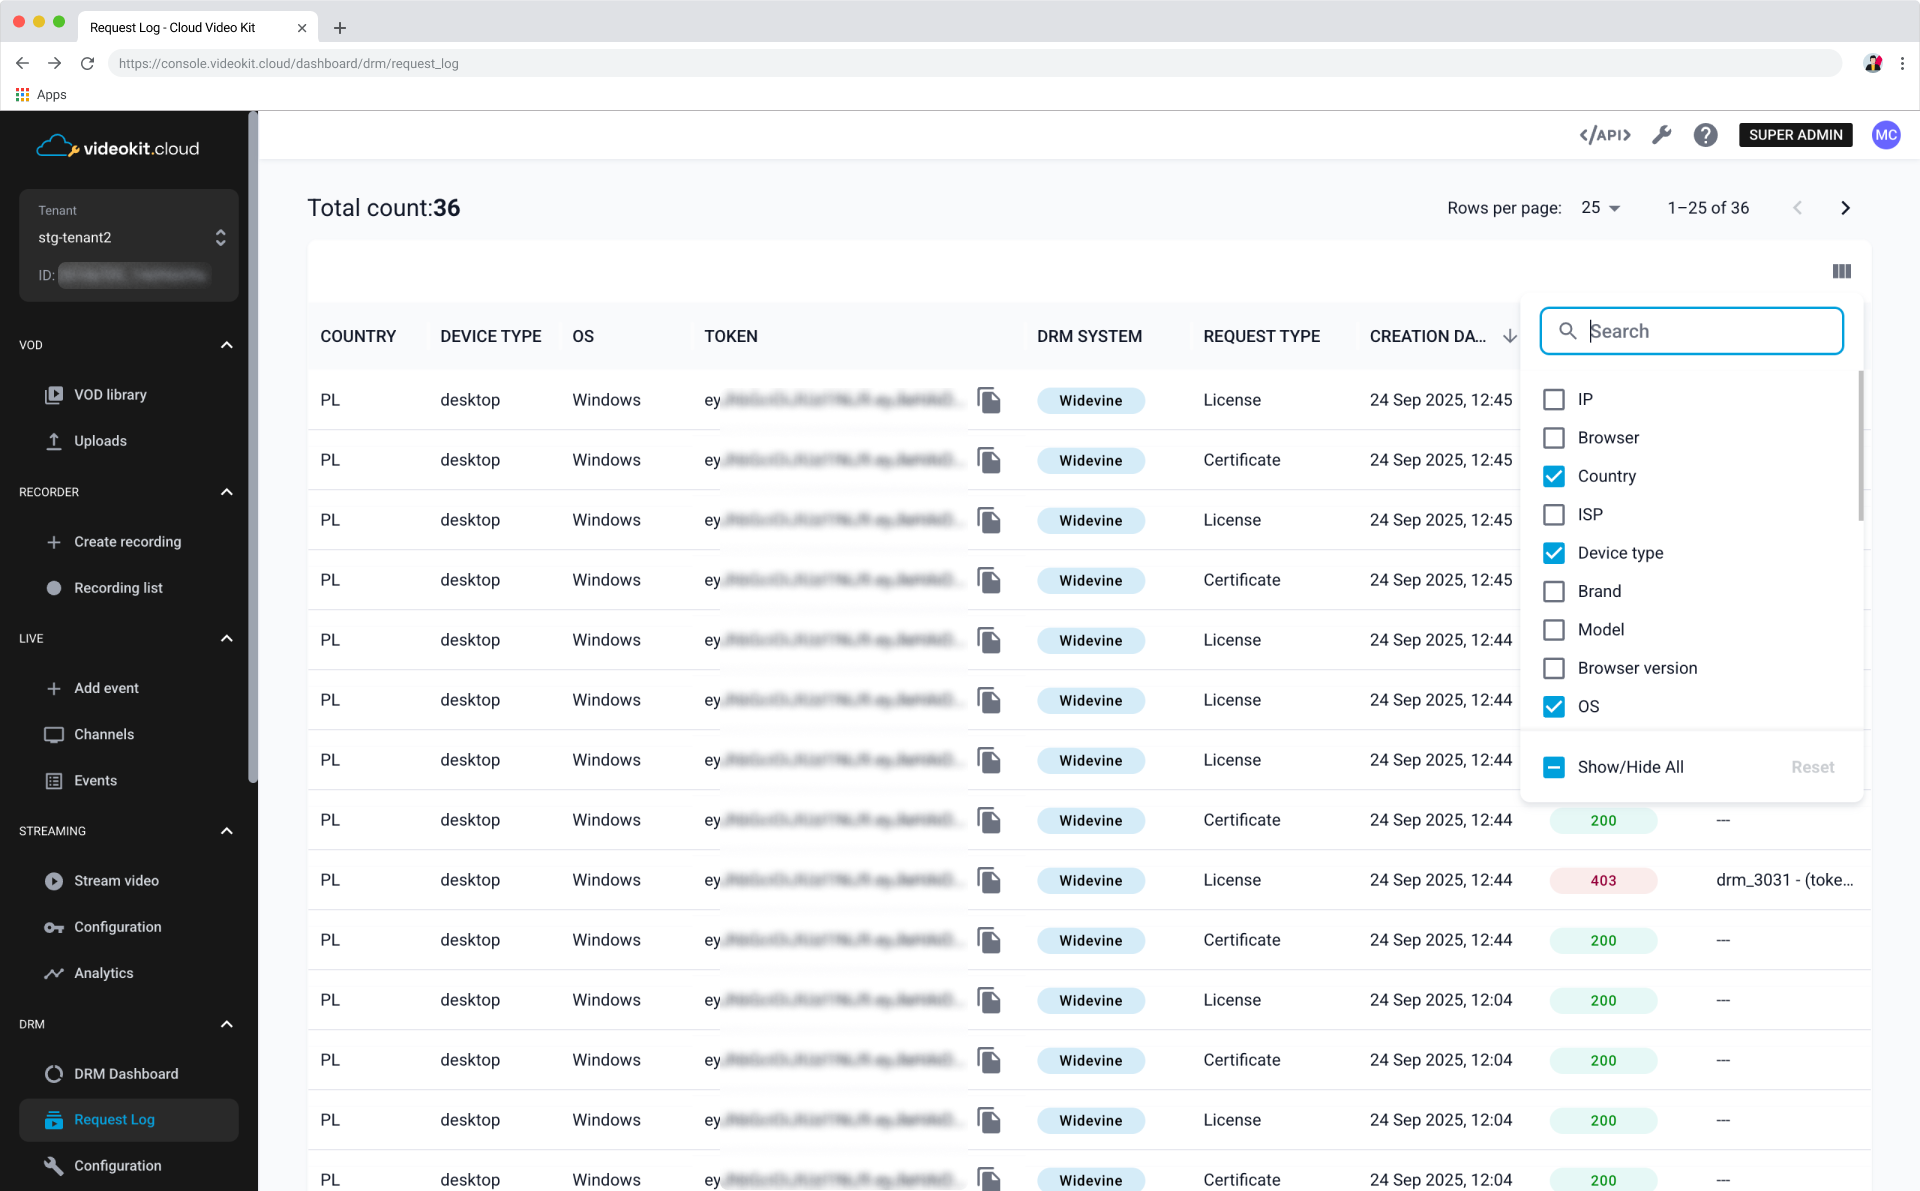
Log Table Columns
The table provides comprehensive details for each DRM request. You can select from a range of columns to show:
- IP
- Browser
- Country
- ISP
- Device type
- Brand
- Model
- Browser version
- OS
- OS version
- Token user ID
- Token content ID
- License URL
- Payload length
- Response length
- User agent
- Token
- DRM system
- Request type
- Creation date
- HTTP status
- Error code